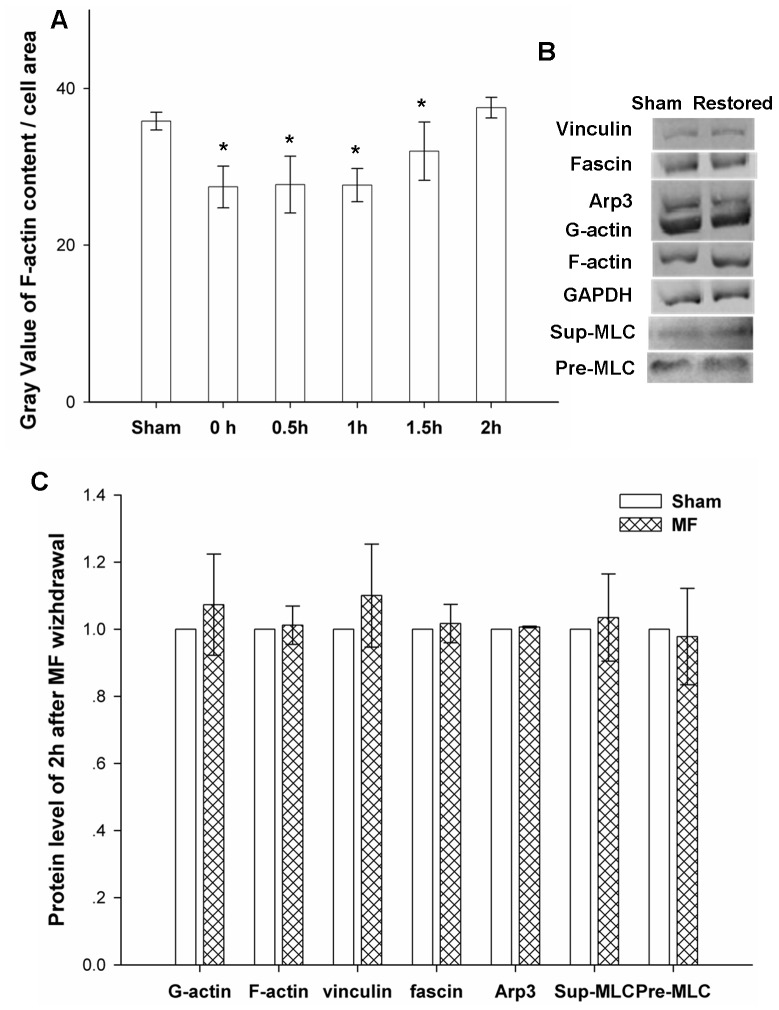
Figure 6. The influence of power frequency MF was greatly reducedby 2hours after withdrawal of the field.
A: Time-dependent recovery of F-actin content after withdrawing power frequency MFs. Sham: sham-exposed to power frequency MF for 0.5 hours; 0–2 h: exposed to power frequency MF for 0.5hours,field withdrawn and then sham-exposed for 0hour to 2hours; the summary of the gray value analysis of F-actin and cell area was analyzed by software ImageJ; compared with Sham, 0–1.5 h P<0.05 (*), 2 h P>0.05. B: content of vinculin, fascin, MLC and Arp3 proteins in FL cells 2 hours after withdrawing power frequency MF; C: gray value summary of vinculin, fascin, MLC and Arp3 content in FL cells 2 hours after exposing to MFs by software ImageJ, compared with Sham, P>0.05. The detailed information of experimental conditions and repeating numbers of samples is seen in Table 1.

