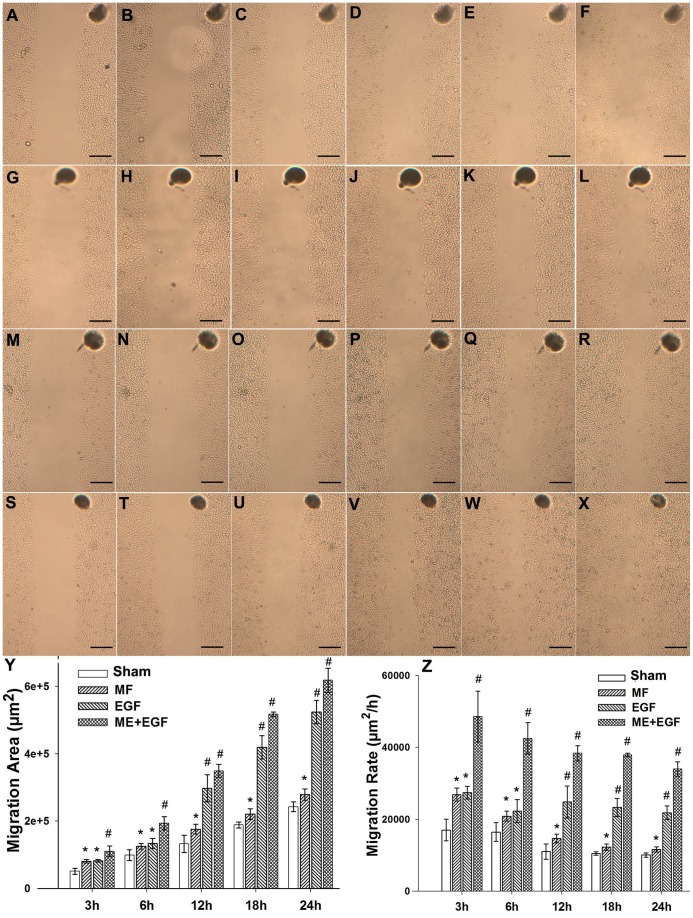
Figure 8. Influence of power frequency MF on the average migration rate of FL cells.
A–F: Sham for 0 h, 3 h, 6 h, 12 h, 18 h, and 24 h successively; G–L: MF for 0 h, 3 h, 6 h, 12 h, 18 h, and 24 h successively; M–R: EGF for 0 h, 3 h, 6 h, 12 h, 18 h, and 24 h successively; S–X: MF+EGF for 0 h, 3 h, 6 h, 12 h, 18 h, and 24 h successively; Y: Effects on FL cell migration area; the areas were calculated by software ImageJ; compared with Sham, P<0.05(*) or <0.01(#); Z: Effect on the migration rate of FL cells, compared with Sham, p<0.05 (*) or <0.01(#). Bar: 200 µm. The repeating and experimental condition information is seen in Table 1.

