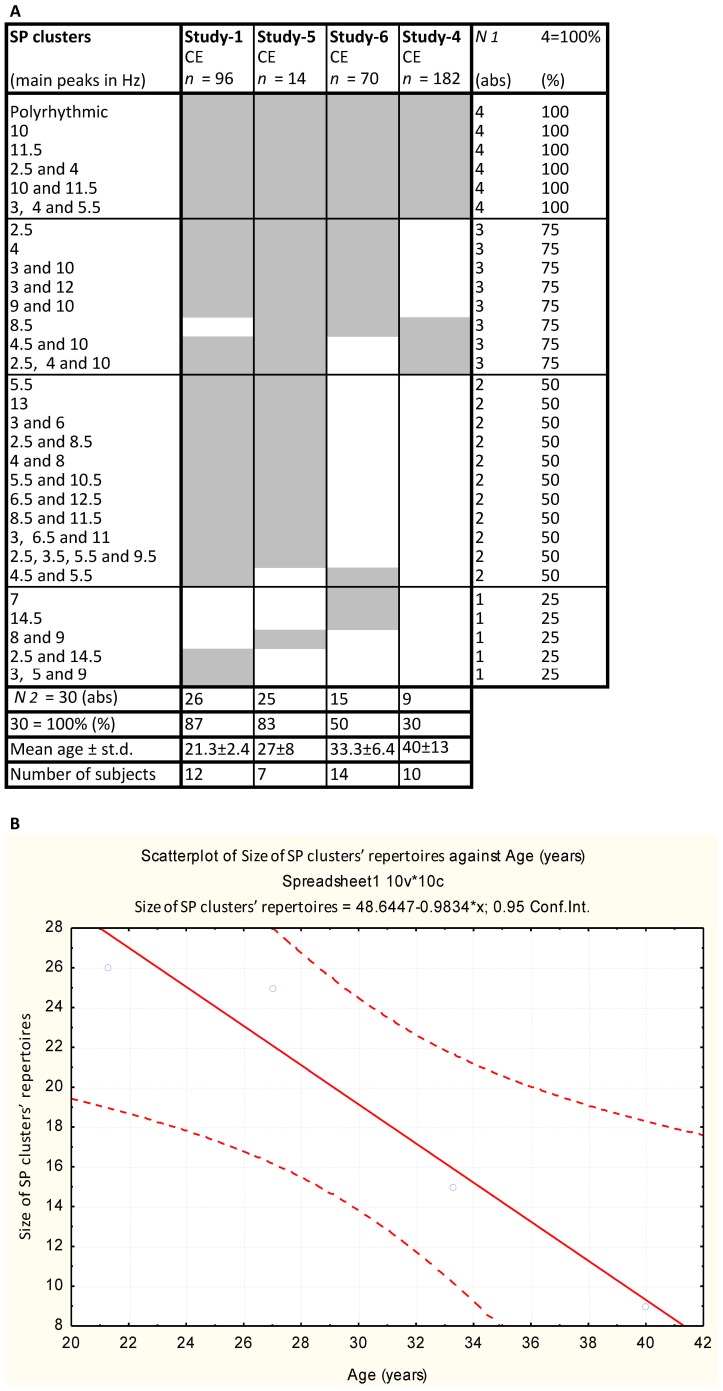
Figure 3. Repertoires of SP clusters in four resting conditions with eyes closed (examined over four studies).
(A). Only healthy subjects from each study were taken into analysis. A sequence of four studies arranged in accordance to the mean age of subjects participated from younger to older age. The list of SP clusters is organised in accordance with the frequency of each SP cluster occurrence across 4 resting conditions, the most frequent being on the top. CE = closed eyes, n = the number of EEGs for each condition, N1 = the number of studies for which a given SP cluster has been observed, N2 = the number of SP clusters in repertoires for each condition, abs = absolute values, st.d. = standard deviation. (B) Scatter plot of size of SP clusters’ repertoires vs. age is presented.

