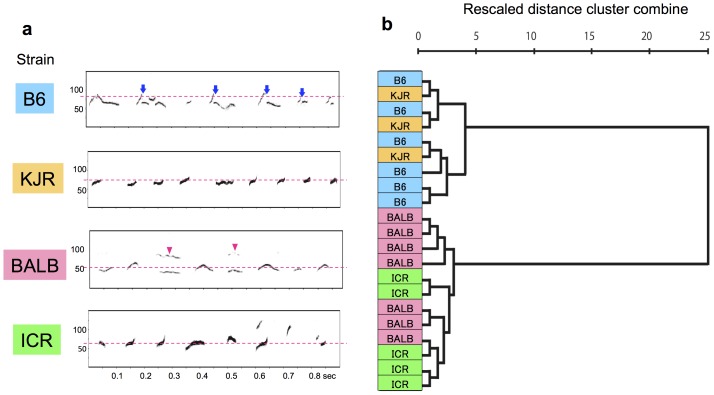
Figure 1. Strain-specific characteristics of male mouse songs.
(a) Representative spectrogram of the songs from B6, KJR, BALB, and ICR. Arrows and arrowheads indicate the “Jump” (B6) and “Harmonic” waveforms (BALB), respectively. The dotted lines indicate the average peak frequency of each song (B6, 79 kHz; KJR, 75 kHz; BALB, 55 kHz; ICR, 66 kHz). (b) Cluster analysis using the following parameters: mean peak frequency of syllables, interval between syllables, duration of syllables, and percentage composition, for each waveform category among B6, BALB, ICR, and KJR male individuals (B6, n = 6; BALB, n = 7; ICR, n = 5; KJR, n = 3). There were 2 major song groups: BALB and ICR, and B6 and KJR.

