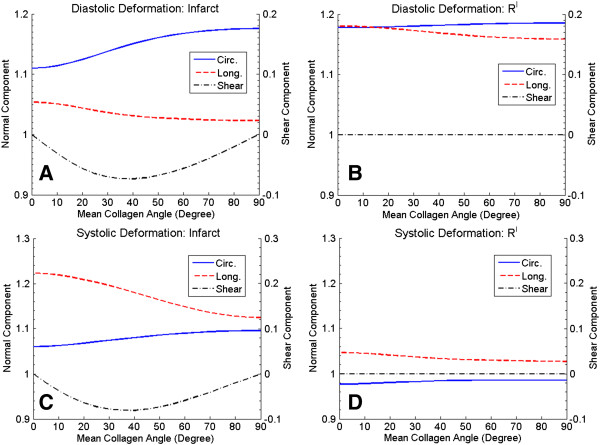
Figure 6.
Deformation and stress. Diastolic deformation of the scar (A) and remote region RI(B) and systolic deformations of the scar (C) and RI regions (D) plotted as functions of mean collagen alignment angle. The normal components of the deformation gradient (circumferential and longitudinal) are shown on the left vertical axis and the shear component is shown on the right axis.

