
Figure 2. Differentially expressed genes in HEV, HBV and HEV+HBV transfected cell cultures compared to pcDNA3 vector-only control.
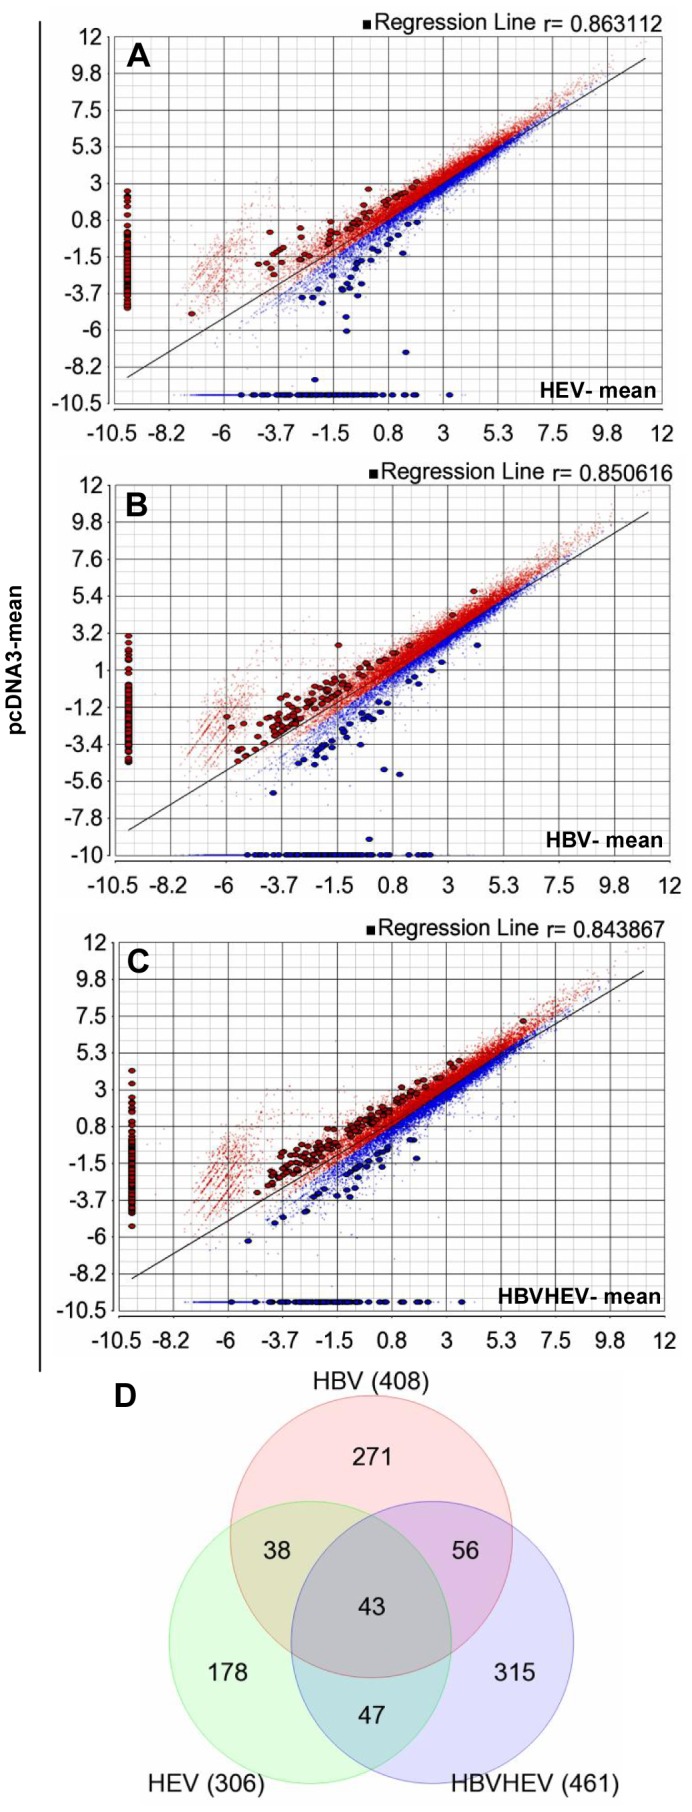
The differential gene expression by Anova for each comparison, HEV vs. pcDNA3, HBV vs. pcDNA3 and HBV+HEV vs. pcDNA3 resulted in (A) 306, (B) 408 and (C) 461 genes with more than +/−2 fold change in expression (up regulated genes are marked in blue and down regulated genes are marked in red) and p value <0.05, respectively. (D) The Venn diagram shows common genes in the three groups.