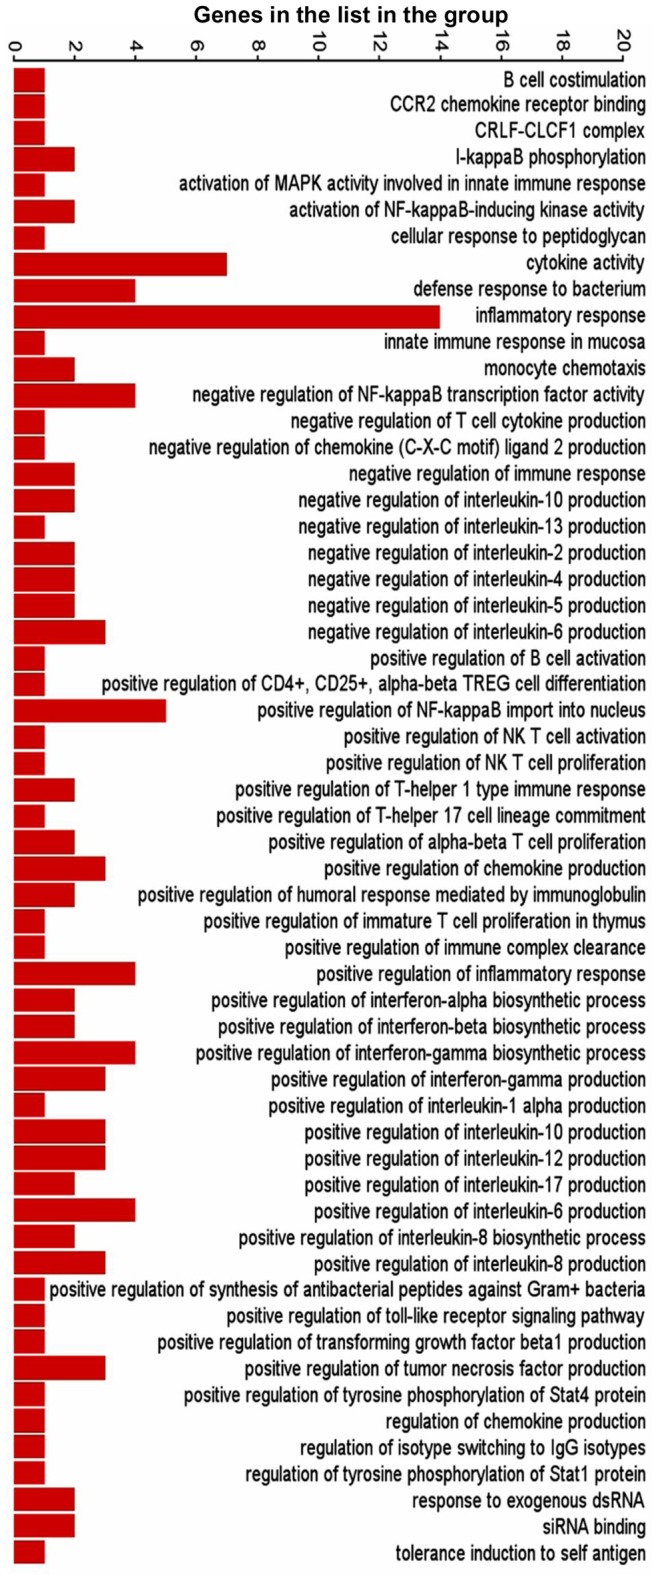
Figure 4. Graphical representation of host defense and survival functions derived by GO enrichment of differentially expressed genes in HBV+HEV transfected cell cultures compared to pcDNA3 control.

Bars represent number of genes in the list present in each functional category.
