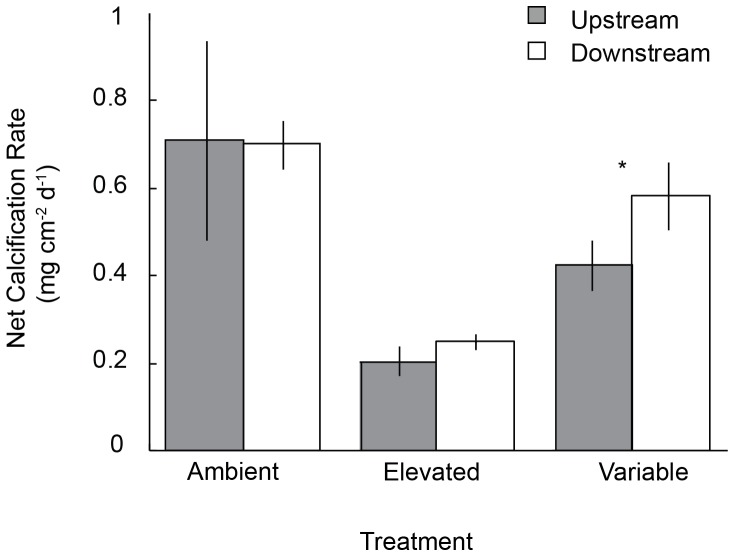
Figure 2. Calcification response of Porolithon onkodes to ocean acidification treatments.
Mean (±SE) rates of net calcification for P. onkodes collected from upstream and downstream habitats after 14 days of exposure to three pCO2 treatments. The asterisk denotes a significant difference of an a priori comparison between upstream and downstream origins under the variable pCO2 treatment.

