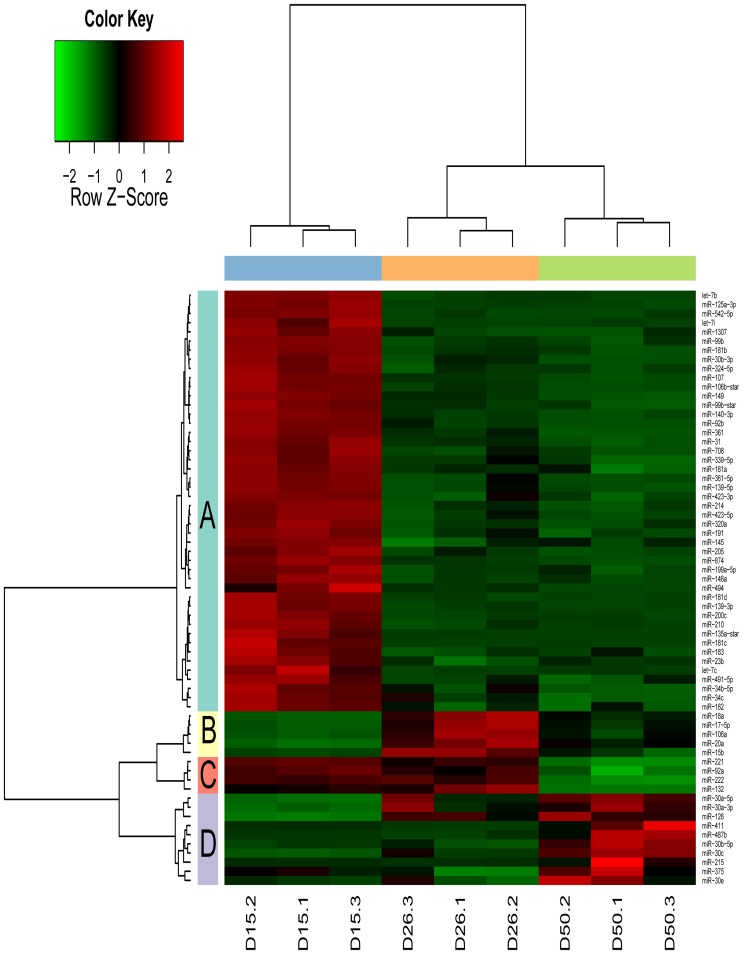
Figure 2. The hierarchical clustering based on differentially expressed miRNAs in porcine endometrium during pregnancy.
Each row represents an individual miRNA and each column represents a sample. A color legend indicating the level of miRNA expression is at the top, with red indicating high expression level and green indicating low expression level. D15: gestational day 15; D26: gestational day 26; D50: gestational day 50.

