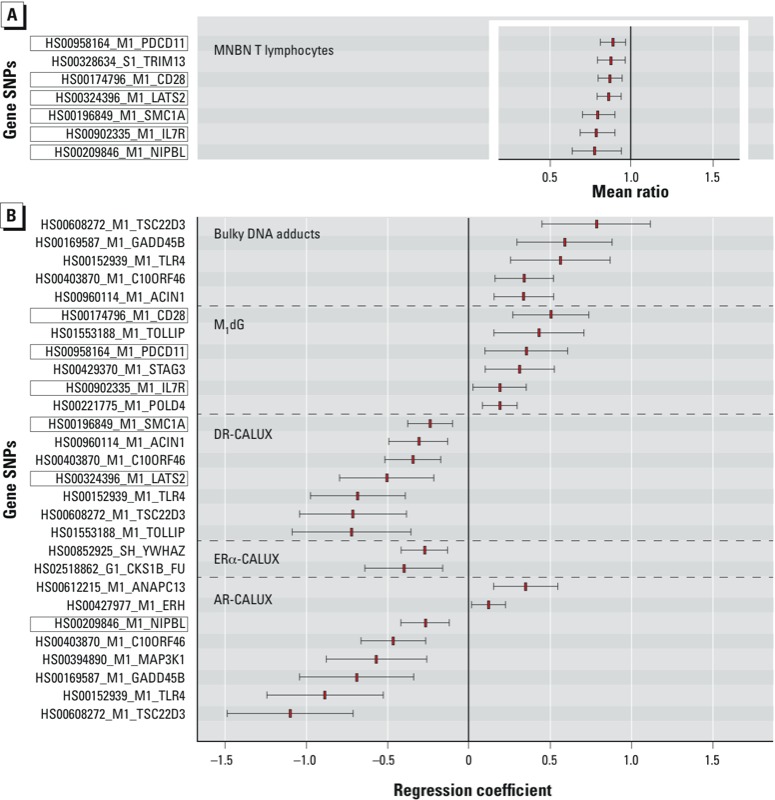
Figure 1.

Associations between gene expression and MNBN T-lymphocyte frequency (A) and between exposure biomarkers and gene expression (B) adjusted for country, maternal age, prepregnancy BMI, birth weight, sex, maternal ethnicity, gestational age, delivery, maternal smoking, and ETS. Associations shown are those with multiple comparisons–adjusted p-values < 0.05. (A) Mean ratios (MR) are for associations between 1-unit increases in gene expression and MNBN based on 350 observations with complete data. (B) Differences in gene expression associated with the highest versus lowest category of exposure biomarkers are based on observations with complete data (bulky DNA adducts n = 398, M1dG DNA adducts n = 533, AR CALUX® n = 457; DR CALUX® n = 477; ER CALUX® n = 457). DR CALUX® categories were based on the following centiles: ≤ 0.13; 0.131–0.23; > 0.23 (pg TEQ/mL plasma) because 46% of the observations were tied (i.e., below the limit of detection of the assay). Boxed genes are significant predictors of MNBN and are significantly predicted by at least one exposure biomarker. Red rectangles are mean ratio point estimates of the associations between 1-unit increases in gene expression and MNBN (A), and regression coefficient point estimates of the differences in gene expression associated with the highest versus lowest category of exposure biomarkers (B). Whiskers are 95% CIs.
