Figure 1. Schematic representation of study area.

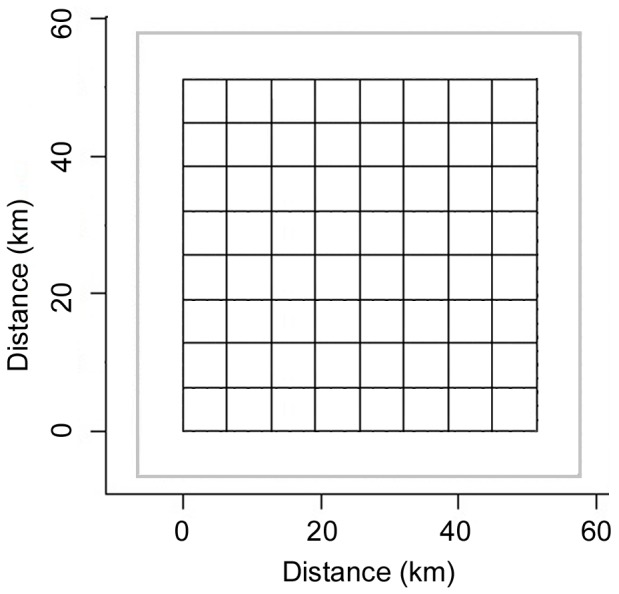
A representation of the 2,264 km2 study area, divided into a grid of 64 cells of 41 km2 each, and set in the center of a 4,100 km2 landscape, which is outlined in gray.

A representation of the 2,264 km2 study area, divided into a grid of 64 cells of 41 km2 each, and set in the center of a 4,100 km2 landscape, which is outlined in gray.