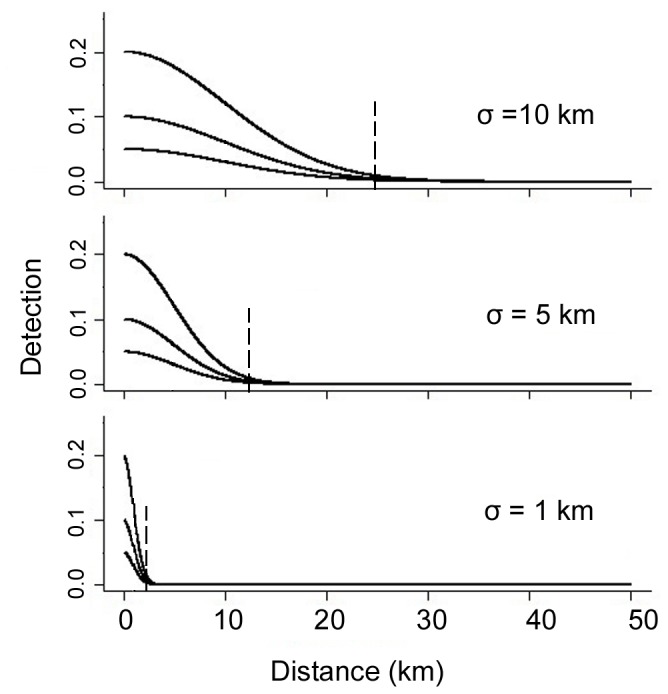
Figure 2. Nine detection scenarios by varying σ and p0.

Nine detection scenarios for N = 500 were created by evaluating three values of the spatial scale parameter, (σ = 10, 5, and 1 km), for each of three baseline detection rates, (p0 = 0.20, 0.10, 0.05). As distance from an individual’s activity center increases, detection decreases according to a half-normal function based on the two parameters. Dashed vertical lines indicate 95% home range radii (σ* ).
).
