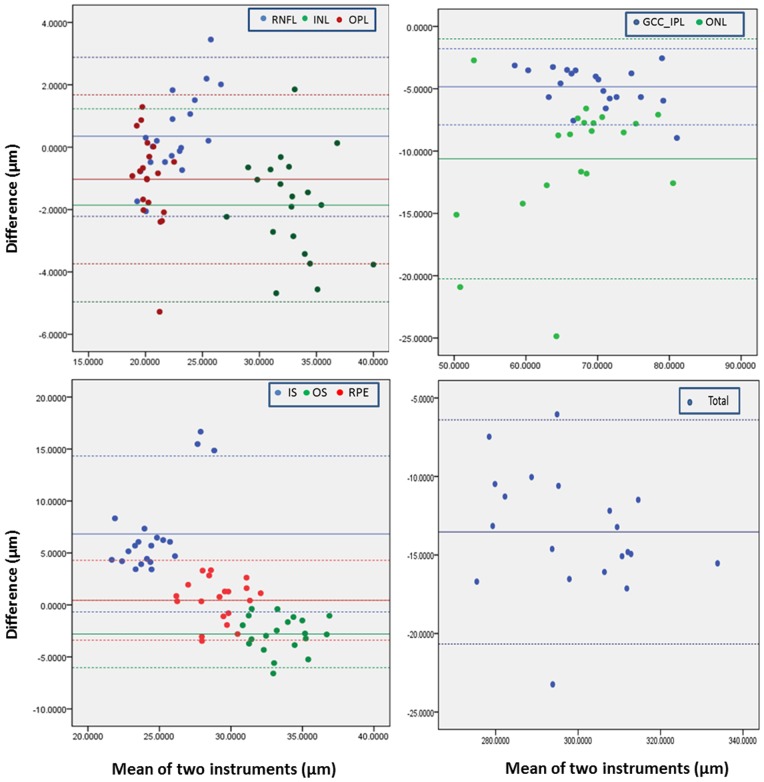
Figure 6. Bland-Altman plots of thickness measurements determined with the automated segmentation algorithm on UHR-OCT and RTVue100 images.
Only the images along the horizontal meridian were analyzed. The horizontal full lines represent the mean of thickness differences, and the horizontal dashed lines represent the mean differences ±1.96 standard deviation.

