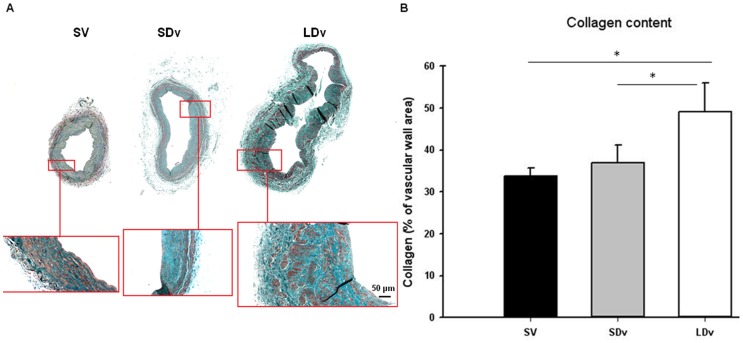
Figure 5. Increase of collagen content in varicose veins.
Histomorphometric measurement of collagen content after Masson’s Trichrome staining (A) in human small and large diameter varicosities (paired SDv and LDv, n = 5) and healthy saphenous veins (magnificence 4X and 10X) (SV, n = 3). (B) Values obtained after Photoshop measurement of colour density. Values are normalized by total surface area; * P<0.05 as determined by one-way-ANOVA followed by the Tukey post-hoc test and by a paired t-test for varicose veins.

