
FIGURE 4.
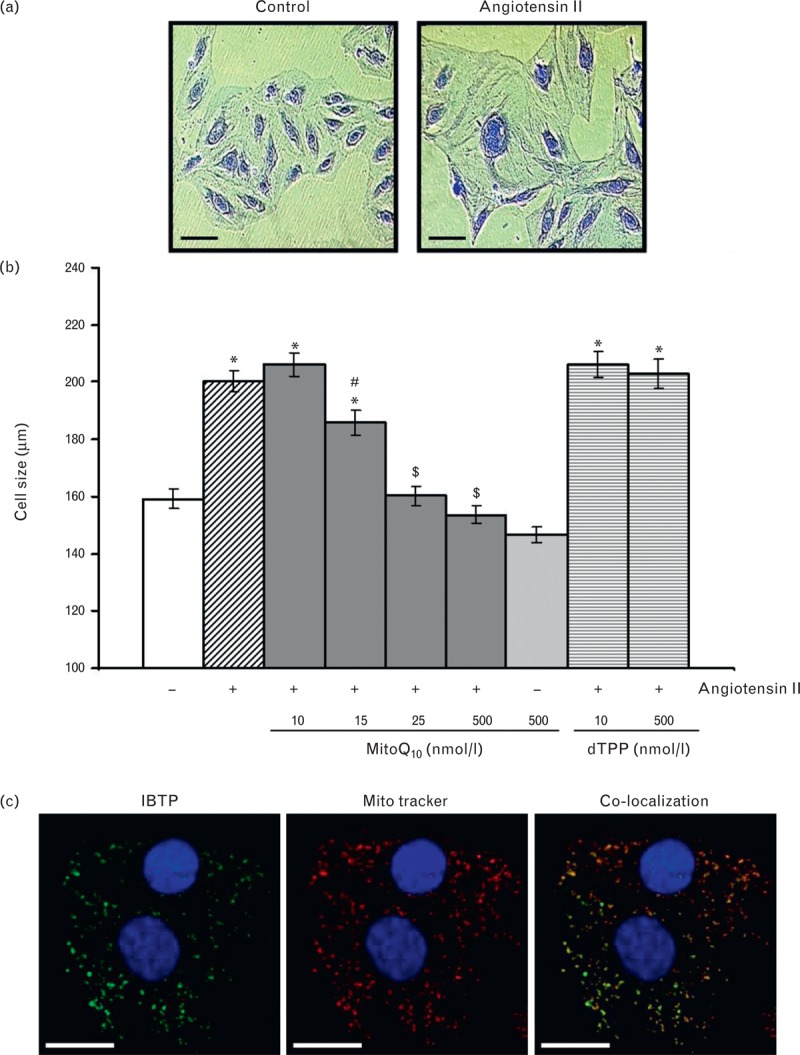
Effect of MitoQ10 on AngII-induced cardiomyocyte hypertrophy. (a) Representative images of control and AngII-stimulated H9c2 cardiomyocytes after 96 h incubation and crystal violet staining (magnification ×10, scale bar = 100 μm). (b) MitoQ10 prevented development of AngII-stimulated hypertrophy in a dose-dependent manner (∗P < 0.001 vs. control, #P < 0.05 and $P < 0.001 vs. 10 nmol/l MitoQ10), whereas dTPP had no effect. (c) The MitoQ10 analogue, IBTP, was detected in cells after 96 h, co-localized with MitoTracker Red. Nuclei were counterstained with DAPI (magnification ×63, scale bar = 50 μm).