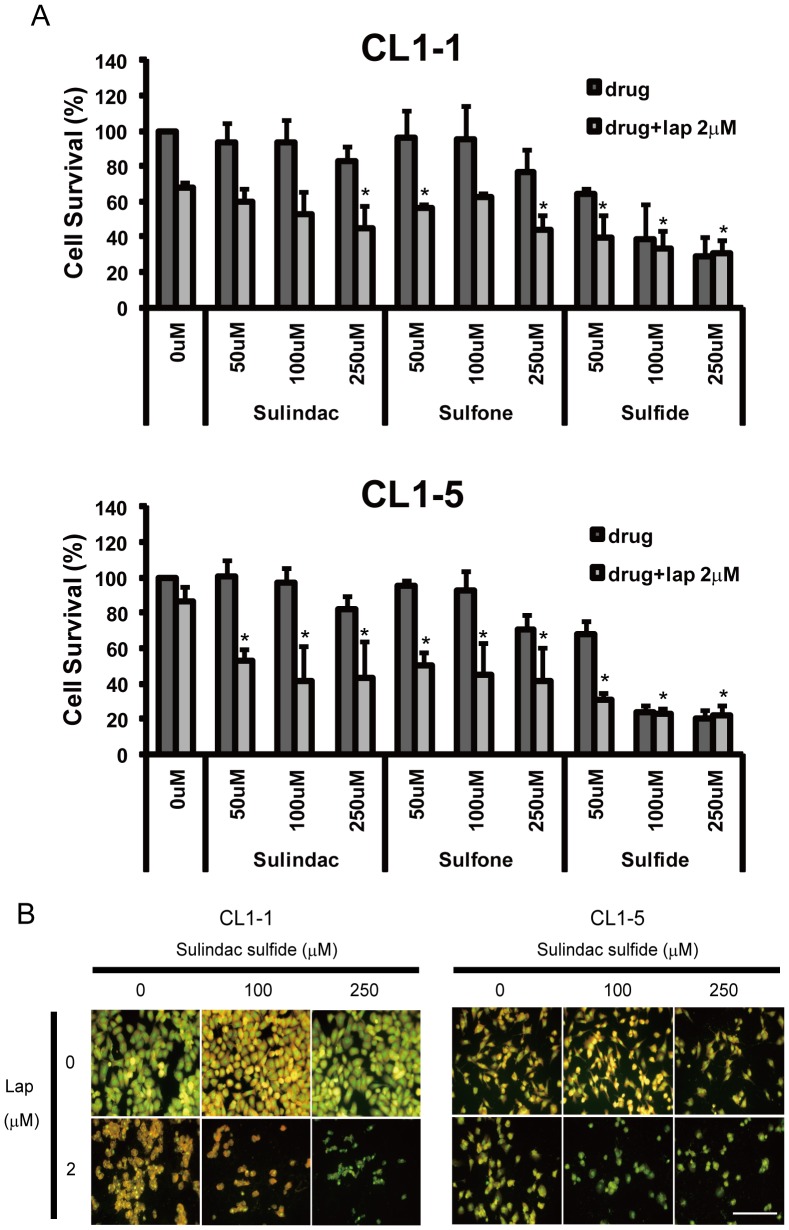
Figure 6. The cytotoxicity of β-lapachone for CL1-1 and CL1-5 cells is enhanced by sulindac and its metabolites.
(A) CL1-1 cells (left) or CL1-5 cells (right) were left untreated or were pretreated for 6 h with the indicated concentration of sulindac, sulindac sulfone, and sulindac sulfide, then 2 µM β-lapachone was added for 12 h, then cell survival was measured using crystal violet staining and expressed as percentage survival compared to the untreated cells. * : p<0.05 compared to β-lapachone alone. (B) Two sets of each cell type were left untreated or were incubated for 6 h with 100 or 250 µM sulindac sulfide, then 2 µM B-lapachone was added to one set and incubation continued for 12 h, then the morphology was examined by acridine orange staining. The scale bar represents 100 µm.

