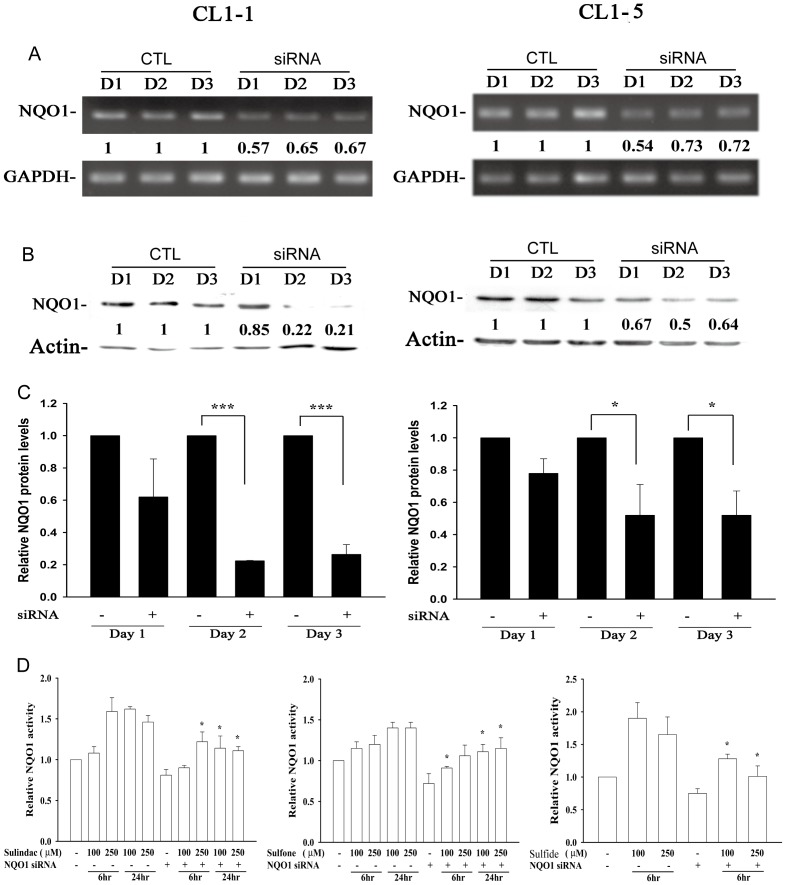
Figure 8. The knockdown effects of NQO1 siRNA on NQO1 RNA, protein, and activity.
(A–C) CL1-1 cells (left) or CL1-5 cells (right) were transfected for 1 to 3 days with control siRNA (CTL) or siRNA targeting NQO1, then RNA expression was measured by PCR (A) and protein expression by Western blotting (B and C). (D) CL1-1 cells transfected for 2 days with control siRNA or NQO1 siRNA were incubated alone or with 100 or 250 µM sulindac, sulindac sulfide, or sulindac sulfone for 6 or 24 h, then NQO1 activity was measured. * : p<0.05, ***: p<0.001 compared to the identically treated cells transfected with control siRNA.

