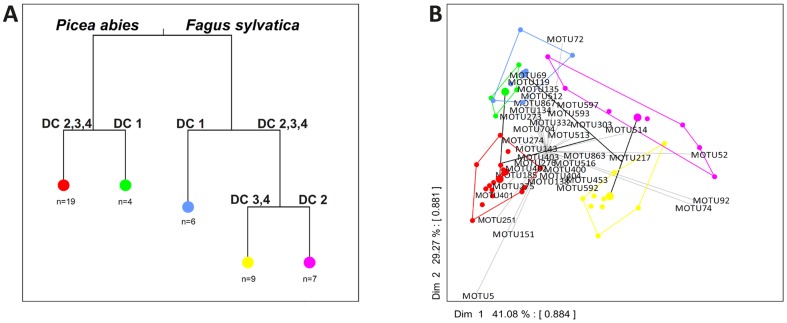
Figure 6. nifH community structure A: Multivariate regression tree of nifH MOTU community composition estimated from sequences of the clone library obtained from dead wood of Picea abies and Fagus sylvatica.
Analyses were conducted for different decay classes, based on the remaining mass per dead wood log after decay using k-means cluster analysis. B: Principal Component Analysis biplots of the group means of the multivariate regression tree. The larger circles (per color) represent the multivariate group means, the individual logs are denoted by smaller circles, with matching colors and designation to Fig. 6A. The identity of selected MOTUs with characteristic discriminatory loading is specified. Each MOTU label is located at its weighted mean from the group means. Intersect correlation is given in brackets.

