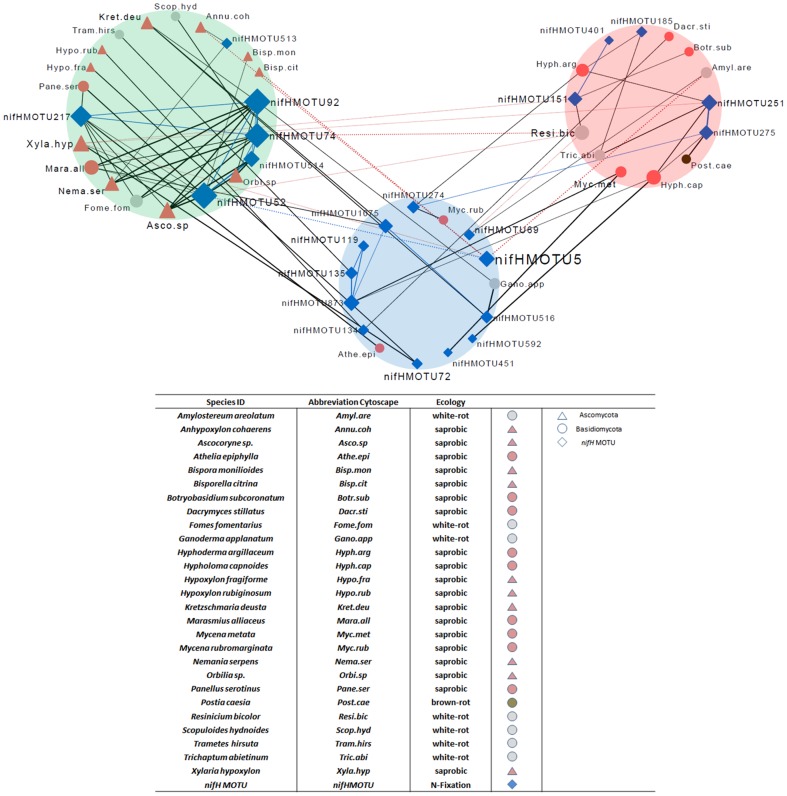
Figure 8. Network organized around 23 nifH MOTUs and 27 fungal species (abbreviations according to the legend).
Fungi (sporocarps) and nifH MOTUs serve as connected nodes, solid lines display co-occurrence patterns (Z-Score < -1.96) and dotted lines avoidance patterns. Edge widths display significance levels from thinnest = 0.049 to thickest = 0.0017. Differently shaped and colored nodes/ hubs display taxonomic differences on phylum level and their ecological role in wood decay. Subnetworks are grouped by tree species, and colored background circles indicate affiliations of included taxa to substrate dead wood species (green = Fagus affiliated, red = Picea affiliated, blue = unaffiliated “Generalists”).

