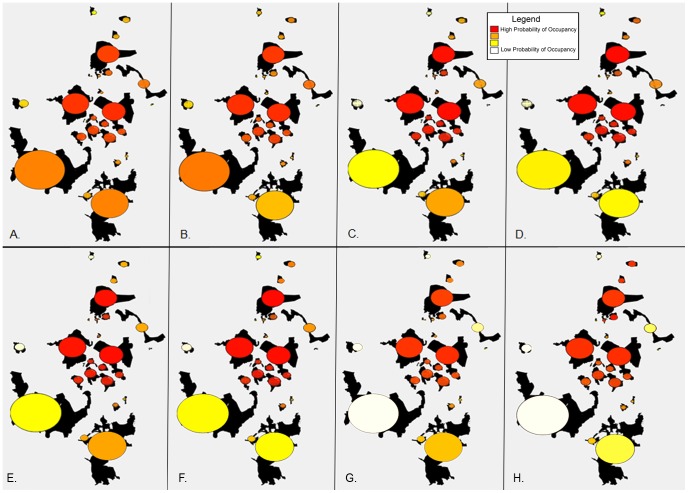
Figure 3. Probability of lion occurrence in identified lion population patches.
Occurrence was calculated on 25 habitat patches in Kenya and Tanzania based on the incidence function model for A) male dispersal using maximum observed distance, without human density, B) male dispersal using maximum observed distance with human density, C) female dispersal using maximum observed distance without human density, D) female dispersal using maximum observed distance with human density model, E) male dispersal using average of observed distances, without human density, F) male dispersal using average of observed distances with human density, G) female dispersal using average of observed distances without human density, H) female dispersal using average of observed distances with human density model. In plotting the results, we used color to show the predicted incidence with warmer colors (redder) showing higher probability of incidence and yellow to white showing lower probability of incidence.

