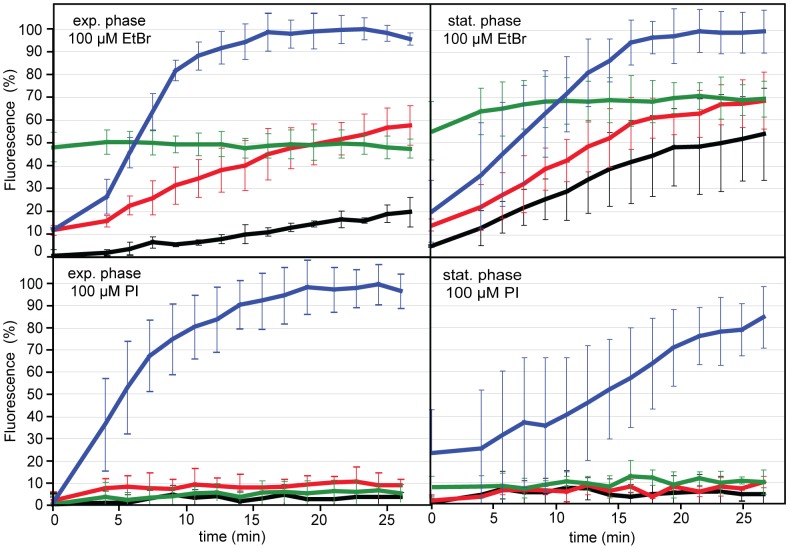
Figure 1. Fluorimetric analysis of EtBr and PI entry into C. jejuni DSM 4688 at different metabolic states and during oxidative stress.
Cells were grown to either exponential phase (OD 0.3–0.7) or stationary phase (OD 1.5–1.7) and diluted to OD 0.2 for the fluorimetric assay. At the timepoint = 0, C. jejuni were confronted with either 100 µM EtBr (upper panel) or 100 µM PI (lower panel) and with distinct effectors. Black, control without effector; red, 150 µg/ml of the efflux inhibitor PAβN; green, 100 µM of the protonophor CCCP; blue, 5% H2O2, leading to C. jejuni cell death. While EtBr enters C. jejuni depending on the metabolic state, PI is passively excluded from viable cells. Mean fluorescence intensities (in 100% of the maximal fluorescence of the respective dead (H2O2) cell suspension reached after saturation (for stationary phase in the presence of PI 100% value was reached after 40 min)) and standard deviations are depicted from at least three independent experiments.

