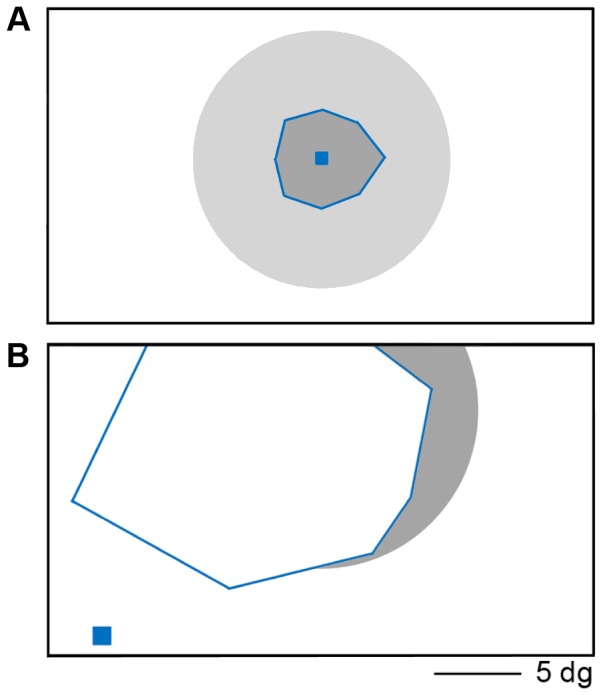
Figure 2. Schematic view of the scanner screen for both patients in the eccentricity mapping paradigm.

(A) schematics for the RP patient, with fixation point (blue square) in the centre of the screen. The grey circle represents the extent of the eccentric stimuli, and the blue lines mark the edges of the remaining visual field. Outside these borders the parts of the stimuli that fall outside the remaining visual field are marked in a lighter grey. (B) schematics for the JMD patient. The fixation point is located in the lower left corner, about 5° away from the lower edge of the scotoma. The scotoma (marked with blue lines) covers the centre of the screen, and is slightly larger at the left. The most eccentric stimuli are visible in the right part of the screen (shown in gray).
