
Figure 3. Relative preference for different eccentricities in lower visual areas without a simulated scotoma.
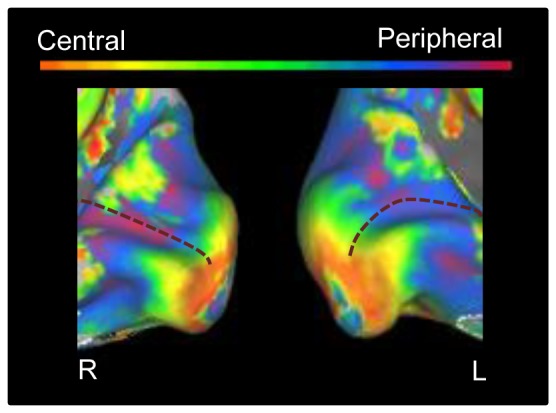
The medial view of the posterior part of right and left hemisphere is shown on an inflated cortical surface for control 2. The approximate location of the calcarine sulcus is marked with a dotted line. The color legend is shown above (orange-red for central stimuli, green for paracentral stimuli, blue-purple for peripheral stimuli).