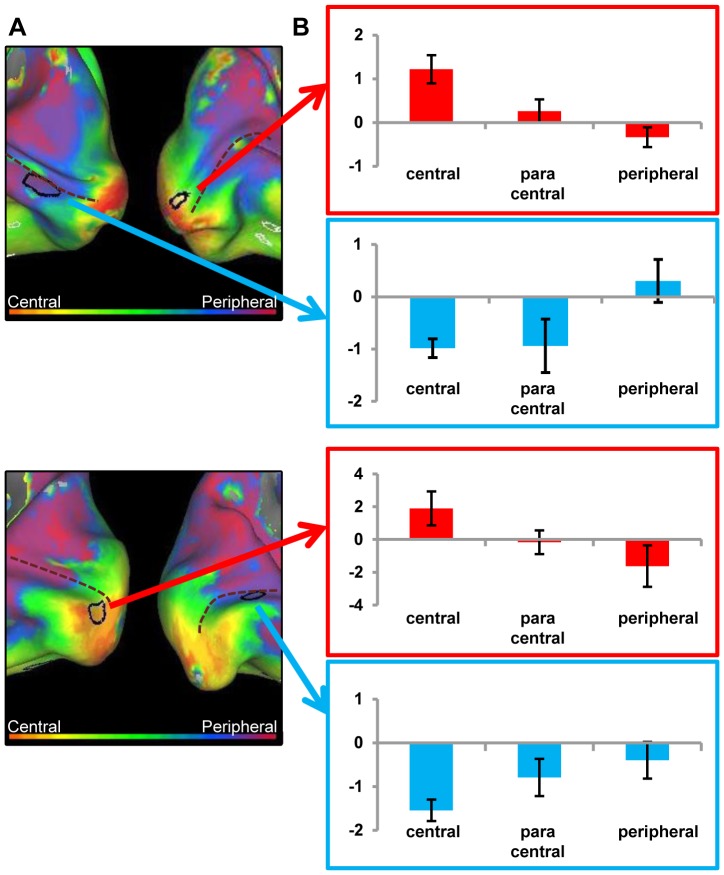
Figure 7. Preference and activity patterns for different eccentricities in lower visual areas for the RP controls.
(A) The medial view of the posterior part of right and left hemisphere is shown on an inflated cortical surface for the two controls (control 1: upper figure, control 2: lower figure). They were tested with the stimulus set simulating the RP scotoma. The approximate location of the calcarine sulcus is marked with a dotted line. The color legend is shown above (orange-red for central stimuli, green for paracentral stimuli, blue-purple for peripheral stimuli) and reflects the relative preference to the different eccentricities. In black two regions are marked which are further characterized for illustration purposes. The data of one region (red arrow/box) are mostly dominated by a positive response and for the other region (blue arrow/box) mostly by a negative response compared to a no-stimulus baseline (B) Average beta values in each selected ROI. The red arrows and box indicate activity of a ROI that shows a positive response to the (visible) central stimuli, while the blue arrows and box show a ROI where negative responses to unstimulated peripheral parts of the visual field cause a phase preference in the absence of activation in the other conditions.

