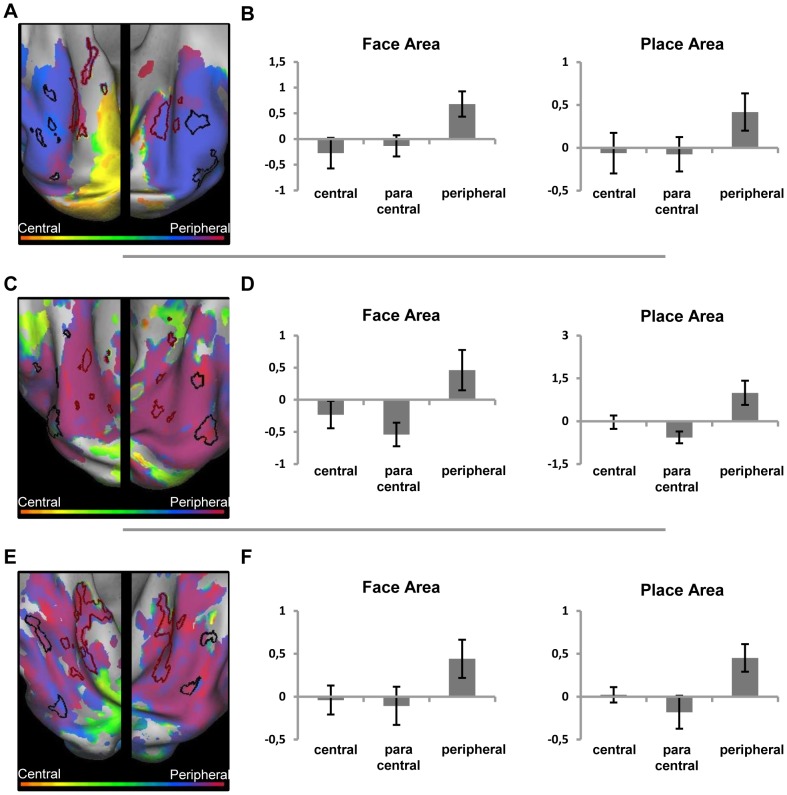
Figure 8. Preference and activity patterns for different eccentricities in the ventral cortex with central (simulated) scotoma.
(Left) Relative preference in the eccentricity mapping paradigm for the JMD patient (A), control 1 (C) and control 2 (E), shown on an inflated hemisphere. The color legend is shown above (orange-red for central stimuli, green for paracentral stimuli, blue-purple for peripheral stimuli). The black lines mark the face-sensitive areas (FA), the red lines mark the house (place)-sensitive areas (PA) defined by the blocked localizer design. (Right) average beta values of three conditions, when the eccentricity data are analyzed as a block design and compared to a fixation baseline, in both the FA and PA region for the JMD patient (B), control 1 (D) and control 2 (F).

