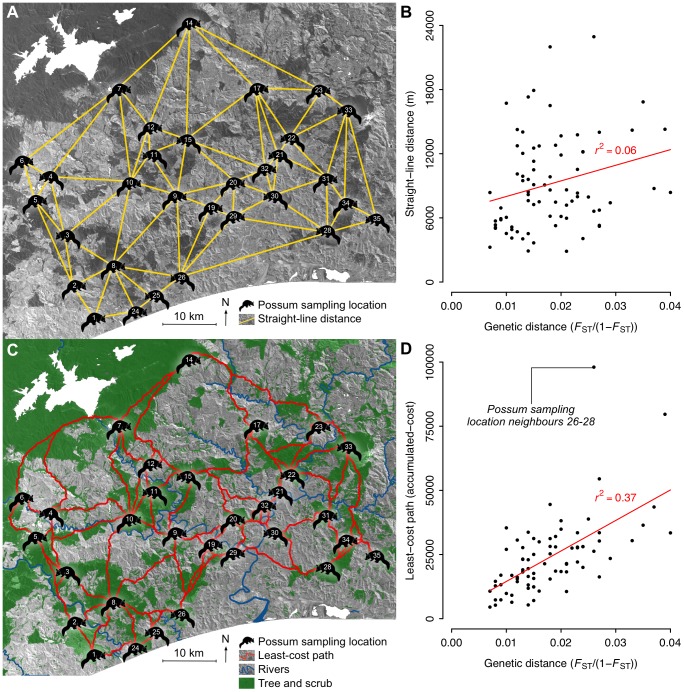
Figure 4. Comparing genetic distance with straight-line distance and accumulated-cost.
Examples of two of the 48 landscape representations used to measure the direct transfer costs between 77 neighbouring possum sampling locations for which genetic distances had been measured. Assuming (A) a uniform landscape representation (D, in Table 2), connectivity was measured as straight-line distance that (B) explained little of the variation in genetic distances. By using (C) a cost-surface landscape representation that incorporated transfer costs associated with rivers and the absence of tree and scrub cover (DTR, in Table 2), connectivity was measured as the accumulated-cost of least-cost paths that (D) explained approximately a third of the variation in genetic distance.

