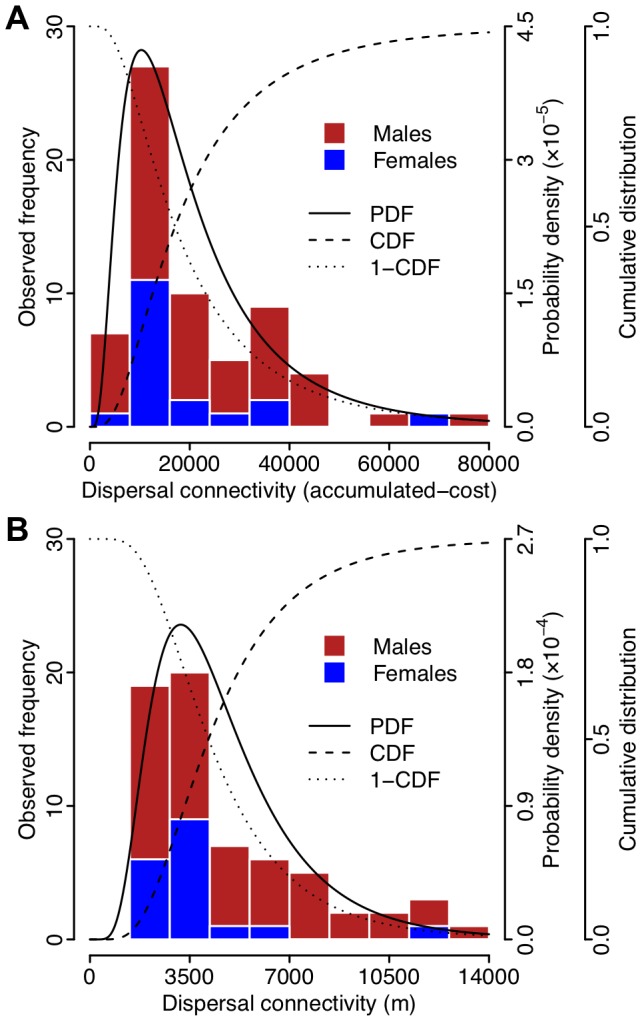
Figure 6. Possum dispersal kernels based on straight-line distance and accumulated-cost.

Examples of the dispersal kernel calibration from connectivity values of observed possum dispersal events for (A) the highest-ranked cost-surface landscape representation (DTR in Table 2), and (B) the uniform landscape representation (D in Table 2). A stacked histogram of the possum dispersal events categorised by sex is shown along with the fitted lognormal dispersal kernel's probability density function (PDF), and both the cumulative distribution function (CDF) and the inverted cumulative distribution function (1-CDF).
