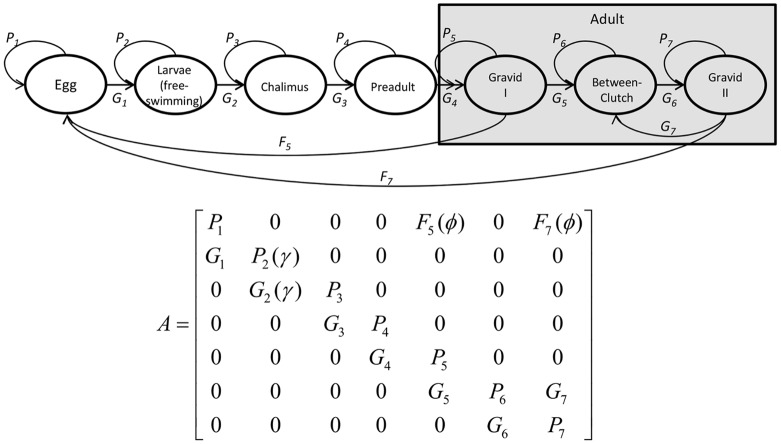
Figure 1. Diagram of stage-structured population projection matrix that is used in simulations.
Pi indicates the probability of staying in a stage, Gi indicates the probability of transitioning to another stage and Fi indicates fecundity. Survival and attachment of free-swimming larvae are a function of the rate that they attach to hosts (γ) and fecundity is a function of the probability of mating (φ).

