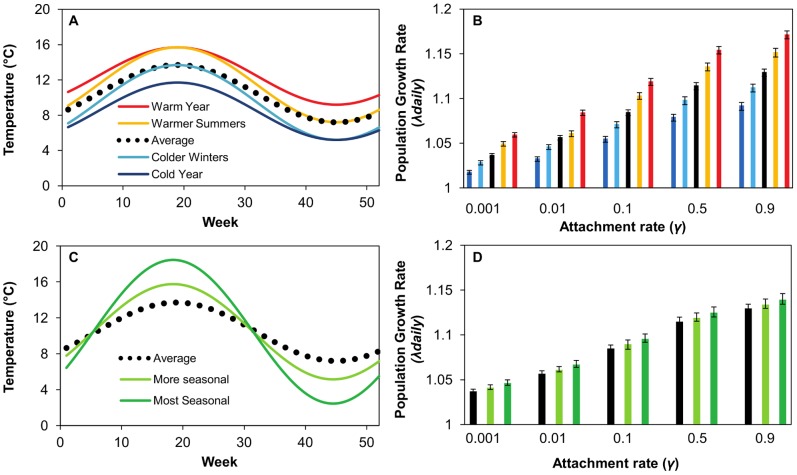
Figure 5. Temperature profiles used for population projection matrices their effect on λdaily.
Minimum and maximum seasonal temperatures were altered relative to a baseline temperature (A) and temperature variance was increased relative to a baseline temperature (C). The daily population growth rate for each of these scenarios is shown (B and D). Baseline temperatures are averages of five years of temperature data from 33 farm sites in Scotland [53]. For all parameters means ± 95% confidence intervals are shown.

