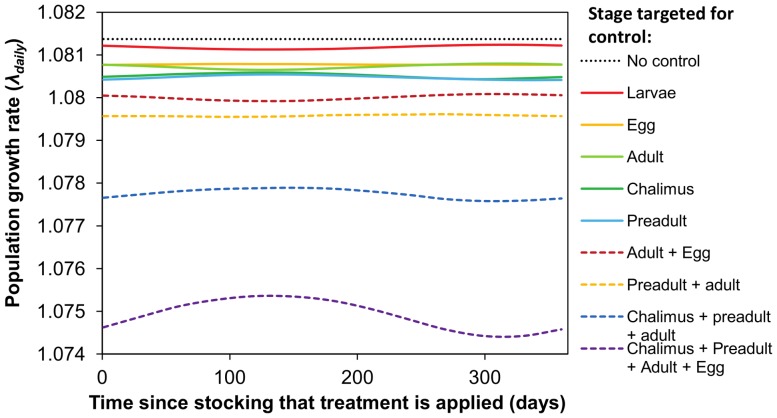
Figure 6. Effect of delivering a single control treatment at different times of the year on the population growth rate (λdaily) of sea lice.
The y-axis indicates the time of year since stocking that the single control treatment was delivered. All simulations assume a spring stocking of salmon smolts, so day 1 is May 1. A treatment efficacy of 95%, a larval attachment rate of 0.1 and the most seasonal temperature scenario were used for all calculations. Results for treatments applied to different life stages are shown.

