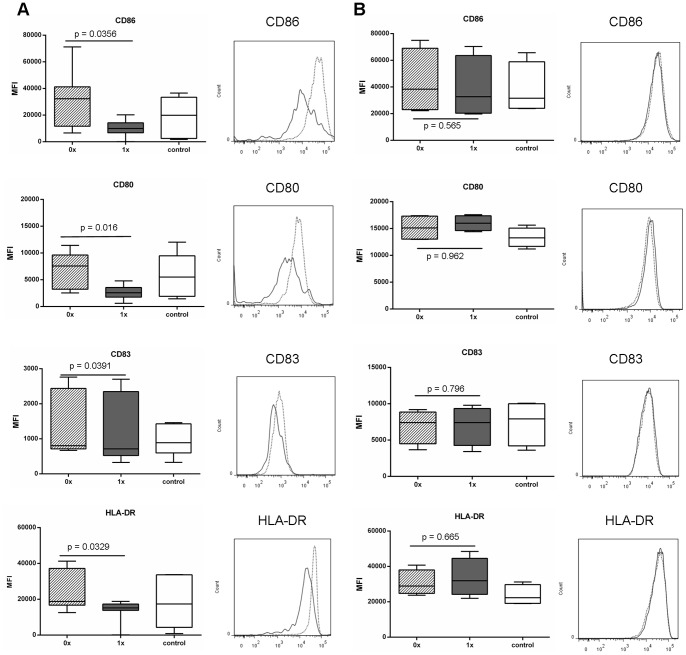
Figure 7. Expression of maturation markers on transduced moDCs.
MoDCs were transduced with either the A) non-ubiquitinated (0x, hatched bar and dotted line) or ubiquitinated (1x, grey bar and grey line) HIV-1 CN54 gag constructs or B) non-ubiquitinated (0x, hatched bar and dotted line) or ubiquitinated (1x, grey bar and grey line) MART-1 constructs or untransduced (control, open bar). Following an overnight incubation, DCs were then matured with LPS and IFNγ for a further 24 hrs and then harvested and stained with the indicated antibodies and analysed by flow cytometry. A) represents 9 donors, and the histogram represents one donor, B) represents 4 donors and the histogram represents one donor and box plots represent the median with upper and lower quartiles, and whiskers represent the min and max values.

