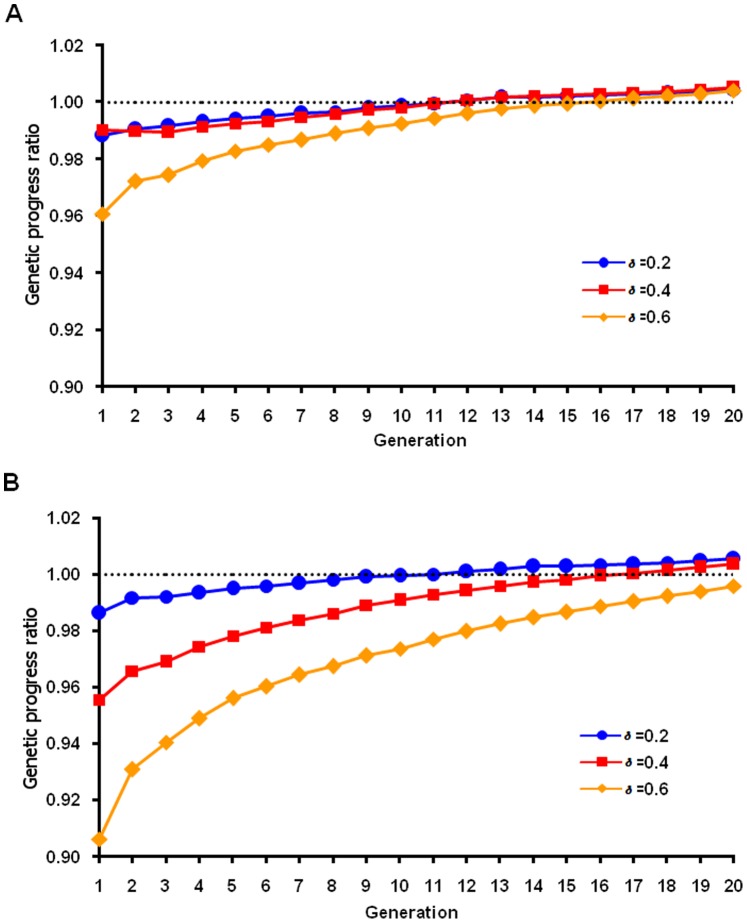
Figure 3. Ratio of adjusted to unadjusted genetic progress by generation for a normal QTL distribution.
The ratio was calculated as the genetic progress for a simulated population based on adjusted genomic breeding value using various δ in the linear (A) and nonlinear (B) adjustment formula divided by genetic progress based on genomic breeding value from unweighted selection.

