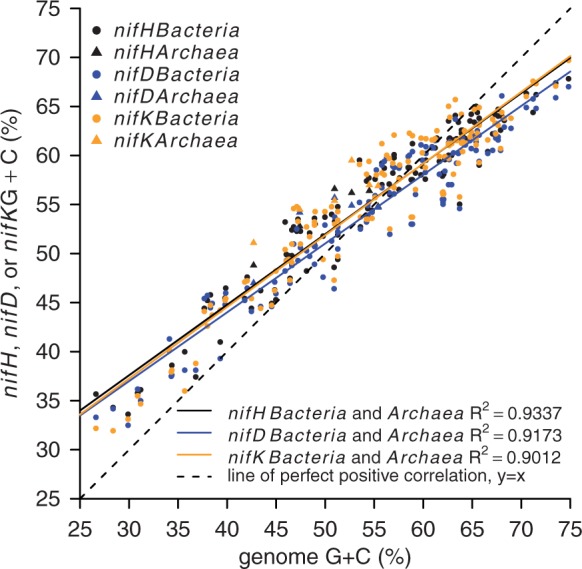
Figure 3.

Sequence G + C content for complete genomes and the G + C content of corresponding nifH, nifD and nifK genes for 6 Archaea and 131 Bacteria. Colors represent different genes, and symbols indicate Bacteria and Archaea as shown in the figure legend.
