
Figure 4.
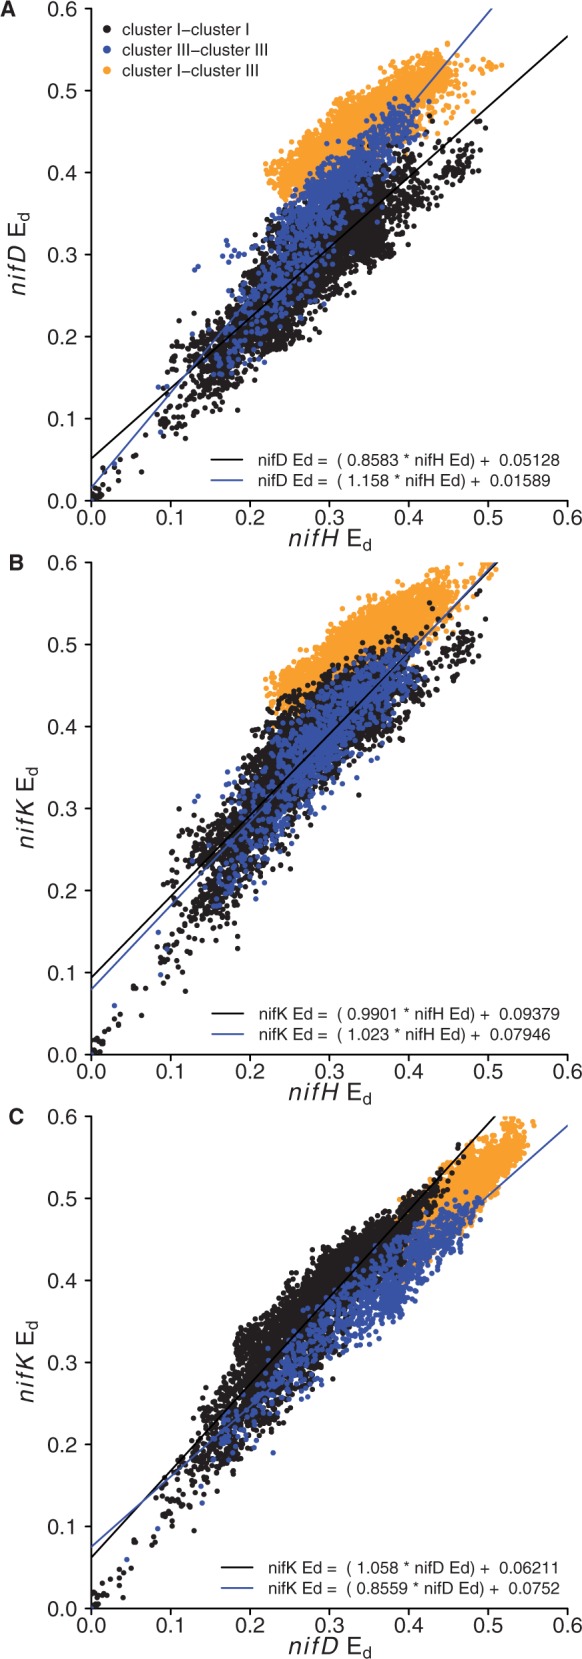
Comparison of relative Ed for nifH and nifD (A), nifH and nifK (B), nifD and nifK (C). The equation for the regression lines are labeled in each panel. Intra-cluster and inter-cluster comparisons are indicated with different colors as defined in the legend.