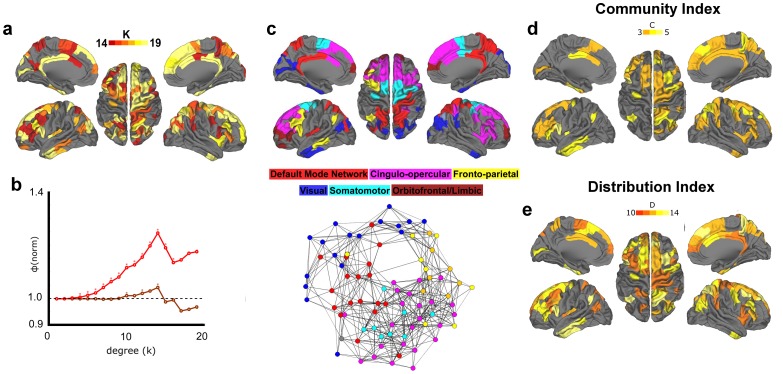
Figure 3. Rich club phenomena in structural group network of adults.
(a) Regions comprising the structural rich club are displayed on an average brain surface. Degree k> = 14 was used to define rich club nodes, reflecting the peak value observed in the weighted rich club coefficient curve in (b). Results highlight the involvement of medial parietal/PCC, superior frontal/ACC, insula, and inferior temporal cortex. (b) Rich club coefficients relative to random are shown as weighted in red and as unweighted in dark red. Significant values (p<.05) are signified with an asterisk. (c) Rich club regions from (a) are colored according to community assignments. Below, a spring embedded graph shows rich club nodes and links between them, reflecting a high level of integration between systems. (d, e) Rich club regions with a high Community Index (C > = 3) and a high Distribution Index (D> = 10) are colored. A large proportion of regions are colored, reflecting high levels of integration.

