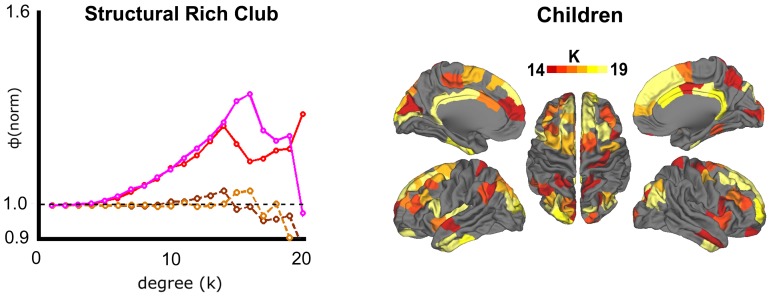
Figure 6. Comparison of structural rich club organization in adults versus in children.
(Left) Normalized rich club coefficients for structural data are shown for weighted (adults = red, solid; children = pink, solid), and unweighted (adults = brown, dashed; children = tan, dashed) networks. No significant differences were observed for weighted or unweighted coefficients. (Right) Regions with degree k> = 14 are shown, to facilitate direct comparison with adults. Results indicate substantial overlap in spatial layout with adults (Fig. 1a).

