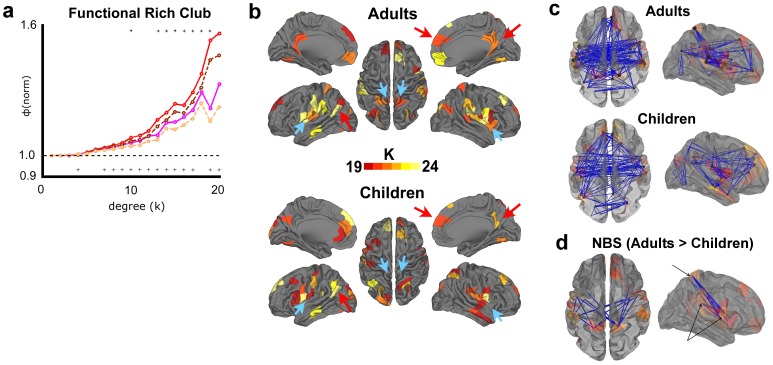
Figure 7. Comparison of functional rich club phenomena and network organization in adults versus in children.
(a) Normalized rich club coefficients for functional data are shown for weighted (adults = red, solid; children = pink, solid), and unweighted (adults = brown, dashed; children = tan, dashed) networks. Significant differences are indicated with an asterisk at the top of the graph for weighted networks, and at the bottom for unweighted. Significant differences are observed (adults>children) across a wide range of k. (b) Rich club regions are displayed for the point of maximal difference in rich club coefficients that was significant (k> = 19). While many regions overlap (red arrows, for example), there are bilateral regions that appear only in adults (blue arrows, for example). (c) Rich club connections (k> = 19) are depicted for adults and for children. (d) Comparisons of the full, unfiltered matrices for adult vs. children subjects (non-group-averaged) using the Network-Based Statistic shows a single bilateral cluster of connections between regions of the insula, supramarginal, and superior parietal cortex. Cluster size was significantly greater in number than what we would expect at random (p<.01, one-tailed, T>4.5; significant clusters centered around the same nodes were also observed at T>4 and T>5 thresholds (p<.05, data not shown)). These connections primarily linked regions of the adult functional rich club as seen in (b) (k > = 19; lightly colored).

