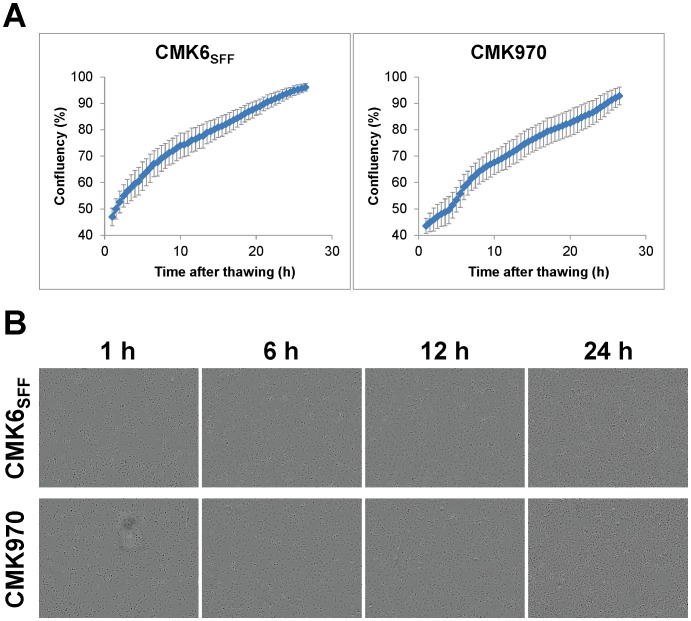
Figure 6. Growth curves of CMK6SFF and CMK970 cells after thawing.
A. Growth curves of CMK6SFF and CMK970 cells after thawing were constructed using the IncuCyte ZOOM System, where the growth curves were built from confluence measurements acquired at 30-min intervals. Values from each time point were averaged across 50 separate regions. Error bars represent 1 SD about the mean for 50 independent regions. B. Representative phase images of CMK6SFF and CMK970 cells at different time points after thawing.

