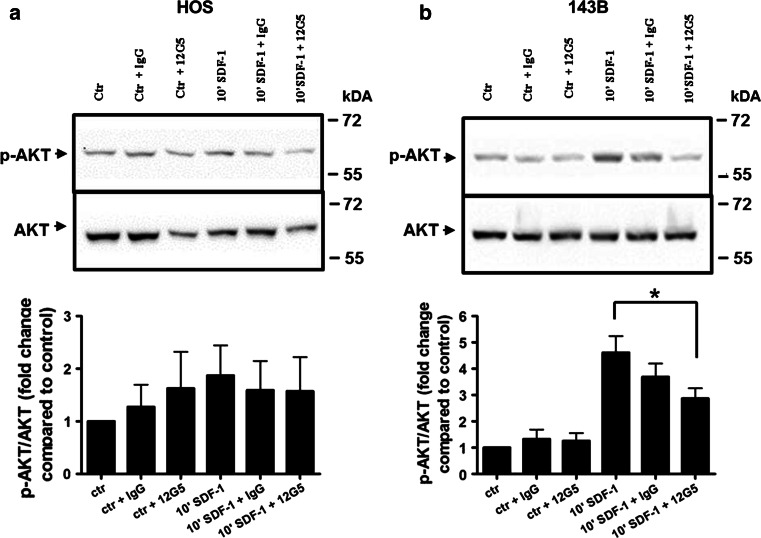
Fig. 3.
AKT signaling inhibition by the blocking anti- CXCR4 antibody 12G5 in 143B and HOS cells. Shown are p-AKT and total AKT levels in HOS (a) and 143B (b) cells that were left untreated (ctr) or stimulated 10 min with SDF-1 (10′ SDF-1) and were pre-incubated with IgG (ctr + IgG and 10′ SDF-1 + IgG) or 12G5 (ctr + 12G5 and 10′ SDF-1 + 12G5) antibodies. Data indicate mean ± SEM (n = 3) levels of p-AKT normalized to total AKT (*p ≤ 0.05 compared to control 10′ SDF-1 stimulation)

