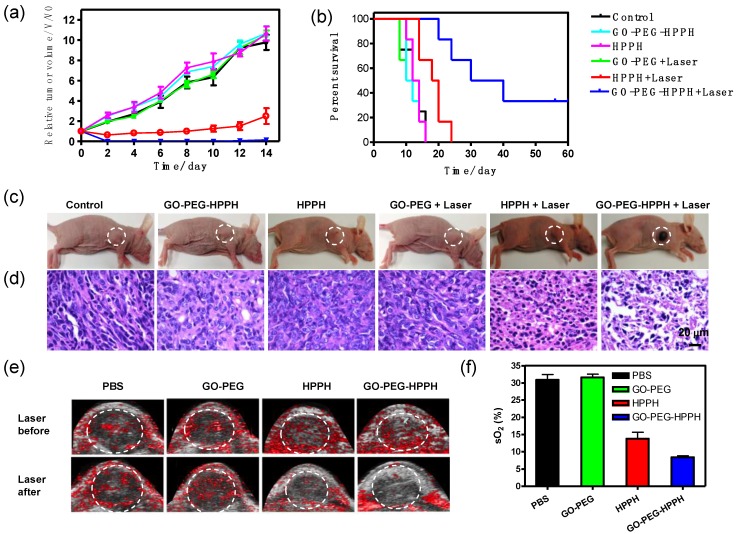
Figure 4.
a) Tumor growth curves of different groups of tumor-bearing mice after treatment. The tumor volumes were normalized to their initial sizes. The error bars represent the standard deviations of 4-6 mice per group. **, p< 0.05. b) The Kaplan-Meier survival curves of different groups of tumor-bearing mice after treatment. c) Representative photos of 4T1 tumor-bearing mice from different groups 14 days after treatment. The circles indicate the location of the tumors. d) H&E stained tumor sections collected from different groups of mice 24 hr post treatment. The GO-PEG-HPPH treated tumor was severely damaged after laser irradiation. e) Ultrasound and photoacoustic imaging of 4T1 tumor-bearing mice before or 24 hr after exposure to 671 nm laser (75 mW/cm2, 20 min). The laser irradiation was performed at 24 h post-injection of PBS, GO-PEG, HPPH, or GO-PEG-HPPH. The circles indicate the region of interest in the tumors. Scale bars: 1 mm. f) Quantitative analysis of fractional oxygen saturation of photoacousitc data.

