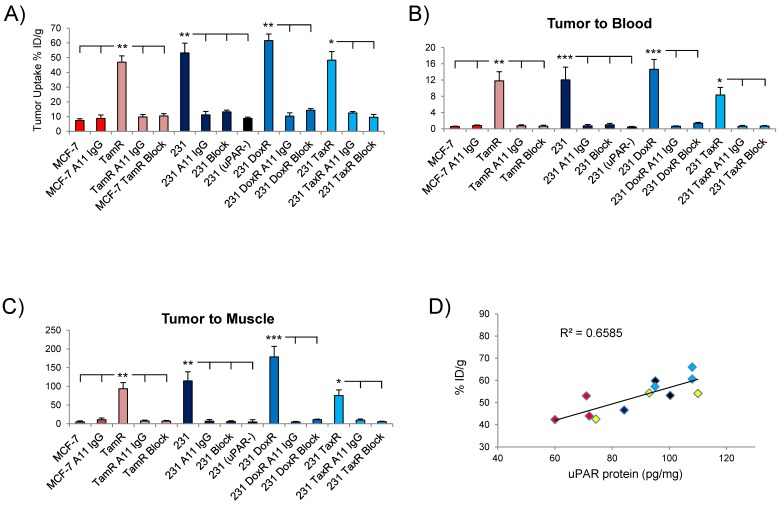
Figure 6.
(A) Graph of the tumor uptake of each xenograft analyzed in the biodistribution study at 72hr. Depiction of the tumor/blood (B) and tumor/muscle (C) ratios of in the different xenografts. (D) Correlation between tumor uptake of 111In-2G10 in the xenografts at 72hr and uPAR protein level. Shown are MCF-7 TamR (red), MDA-MB-231 (black), MDA-MB-231 DoxR (blue) and MDA-MB-231 TaxR (yellow).

