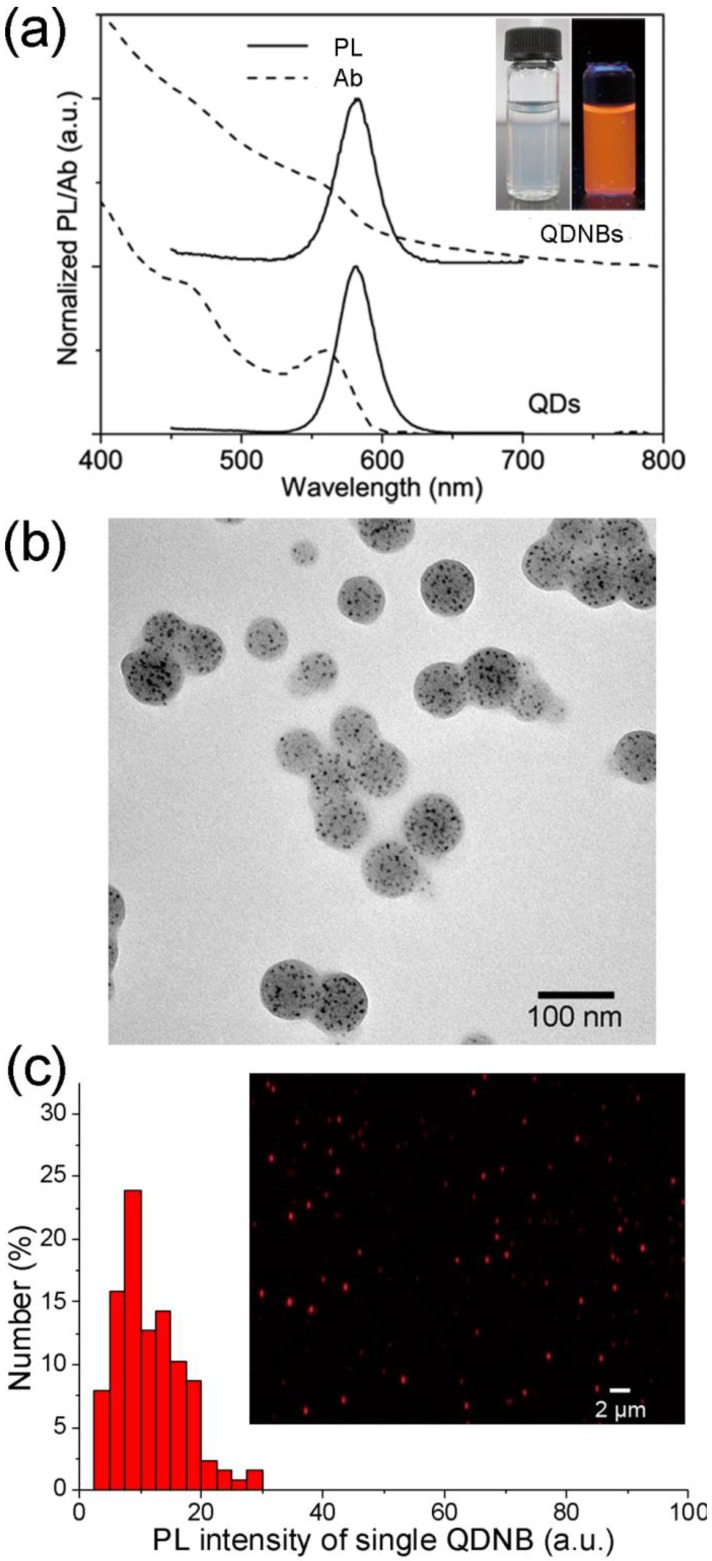
Figure 1.
(a) Normalized absorption and fluorescent spectra of QDs and QDNBs. Inset in (a) shows the aqueous solution of QDNBs under room light (left) and UV light (right). (b) TEM micrographs of QDNBs. (c) The fluorescent intensity distribution and epifluorescent micrographs (inset) of prepared QDNBs.

