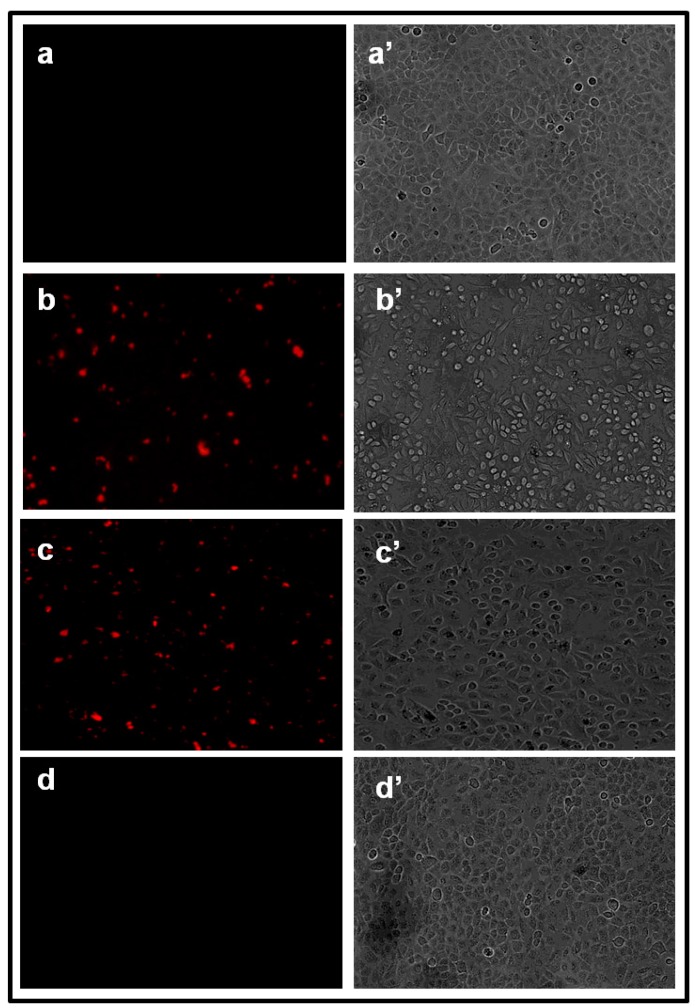
Figure 11.
Fluorescence and the corresponding phase images of untreated A549 cells and cells treated with Olax, b-AgNPs c-AgNPs, observed by an Olympus Fluorescence Microscope. Fluoresence images of A549 cells treated with (a) untreated or control, (b) Olax (100 µg/ ml) leaf extract ,(c) b-AgNPs (at 30 µM) and (d) c-AgNPs (at 30 µM). Images of a', b', c' & d' correspond to phase images. All the treated A549 cells were extensively washed with DPBS (6 times) before taking the fluorescence images. It is to be noted that there is no significant cell killing is observed at 30 µM.

