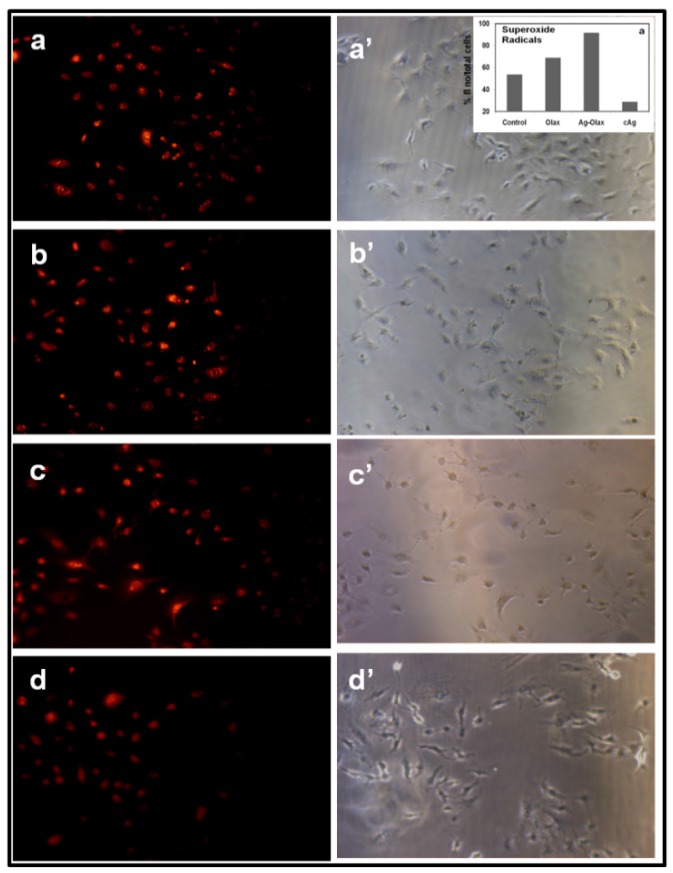
Figure 7.
Formation of superoxide anion inside A549 cancer cell measured by fluorescence microscopy: Fluorescence images of A549 cells treated with (a) nothing; negative control, (b) Olax extract (100 µg/ ml), (c) b-AgNPs at 30 µM and (d) c-AgNPs at 30 µM, respectively. Images of a'-d' correspond to bright-filed phase images. Biosynthesized AgNPs support the formation of super oxide anion inside the A549 cells. Insets of figure.5.a'. shows the quantitative analysis of % (total number of fluorescence/ cell numbers).

