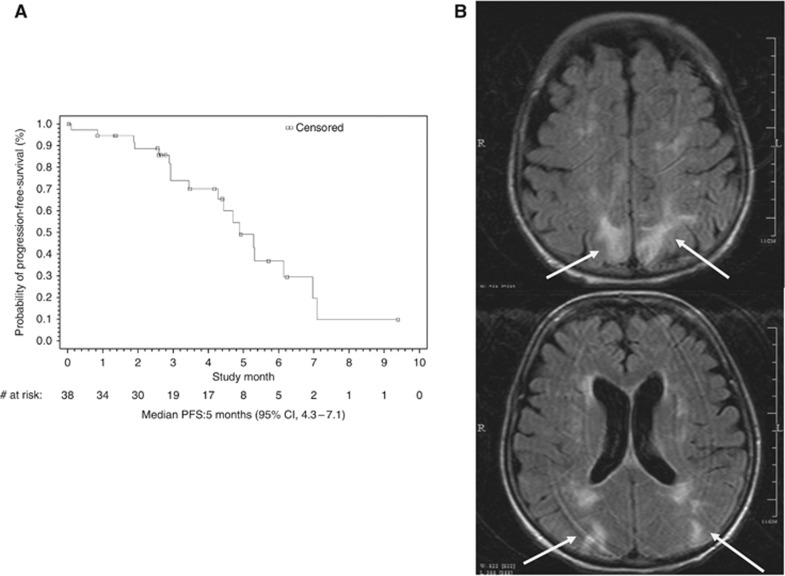
Figure 1.
(A) The Kaplan–Meier curve of PFS (N=38). Median PFS: 5 months (95% CI, 4.3–7.1). (B) Brain MRI of a patient diagnosed with RPLS. Extensive increased T2 signal of a few scattered areas of restricted diffusion and vasogenic oedema in the frontal cortex/subcortical regions near the vertex, and the parietal and occipital regions bilaterally (arrows). No focal enhancing lesions to suggest metastatic disease.

