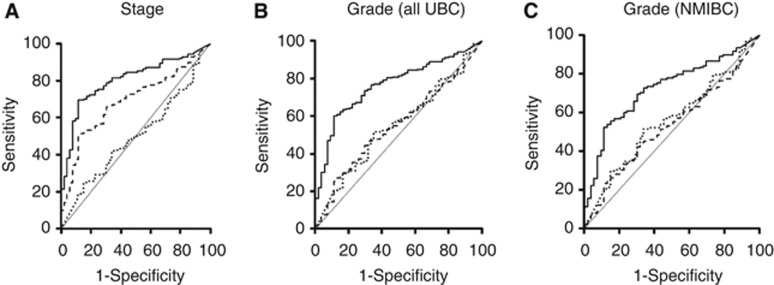
Figure 2.
Detection of UBC using urinary EpCAM.The ROC curves show discrimination between stages of UBC and non-cancer controls (A) grades of UBC and non-cancer controls (B) and grades of NMIBC and non-cancer controls (C). Panel A: dotted line=Ta, dashed line=T1, solid line=T2+. Panels B and C: dotted line=grade 1, dashed line=grade 2, solid line=grade 3.

