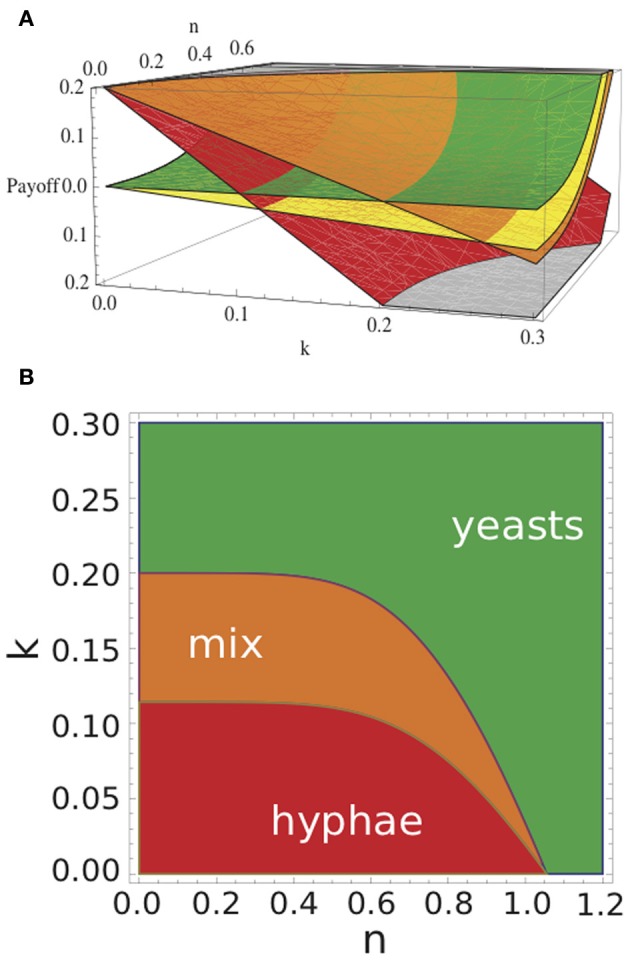
Figure 3.

Payoffs of Candida cells and Nash equilibria of the game with respect to k and n. (A) Red plane shows the payoffs E(h,h) for hyphae in the case where both cells form hyphae. Orange plane indicates the payoffs E(h,y), i.e., for a hypha when coexisting with a yeast cell; in that case, yeast cells will gain E(y,h) (yellow plane); green plane gives E(y,y), i.e., payoff for a yeast cell coexisting with another yeast cell. (B) By varying immune strength k and nutrient n the outcome of the game changes. Red indicates where pure hyphae define the Nash equilibrium, green indicates where pure yeasts define the Nash equilibrium, and orange indicates parameter values where the presence of both yeast and hyphae define the Nash equilibrium. See Table 2 for model parameters.
