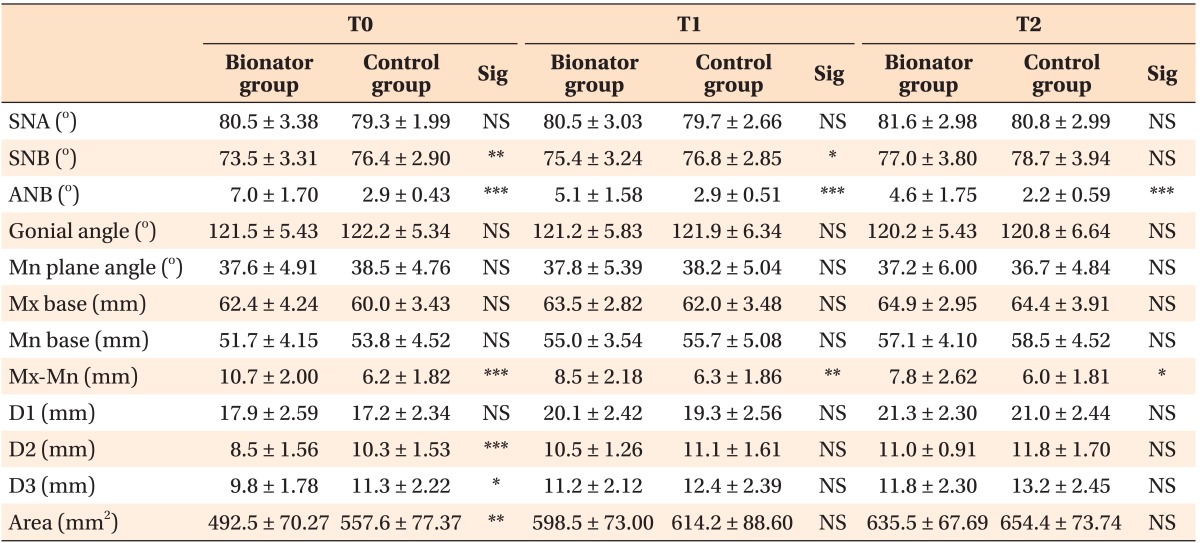
Table 3.
Comparison of measurements between the control and bionator groups

Values are presented as mean ± standard deviation.
Sig, Significance; NS, not significant; *p < 0.05; **p < 0.01; ***p < 0.001.
T0, Initial; T1, right after functional appliance treatment in the bionator group and after the same duration in the control group; T2, growth completion; SNA, Sella-Nasion-A point angle; SNB, Sella-Nasion-B point angle; ANB, A point-Nasion-B point angle.
See Figure 1 for the landmarks and the measurements.
