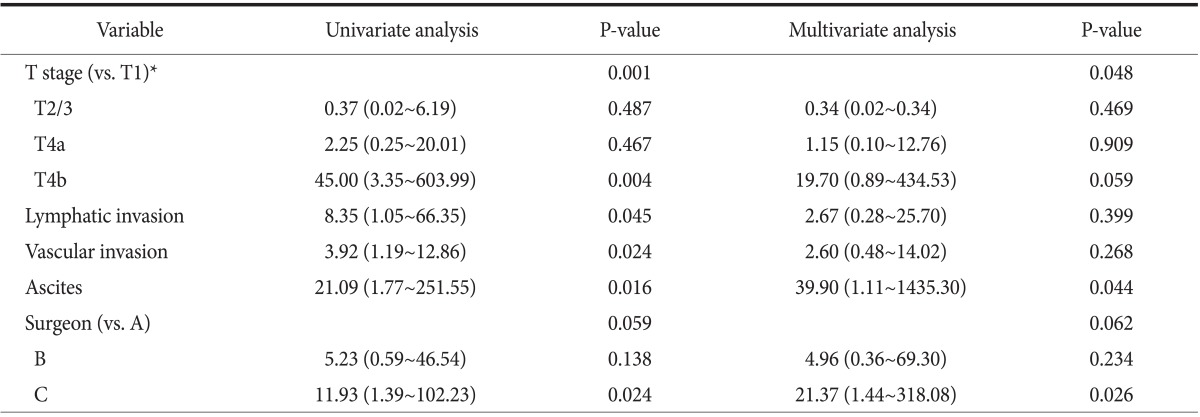
Table 3.
Logistic regression analysis of risk factors for positive cytology in gastric cancer

Values are presented as odds ratio (95% confidence interval). *T and N stage were based on the 7th edition of the American Joint Committee on Cancer cancer staging system.
