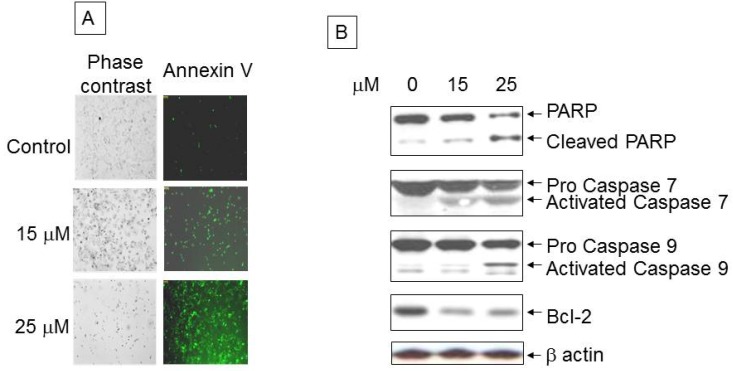
Figure 2.
Analysis of apoptotic cells with ritonavir treatment: (A) Control and 24 h ritonavir-treated PANC-1 apoptotic cells within the same microscopic field were viewed and photographed by phase contrast microscopy and green fluorescence for Annexin V-Biotin-FITC staining. Using the FITC filter, early apoptotic cells appear bright green; (B) Western blot analysis of PARP, caspases 7 and 9, and Bcl-2 with exposure to increasing doses of ritonavir.

